



The Challenge
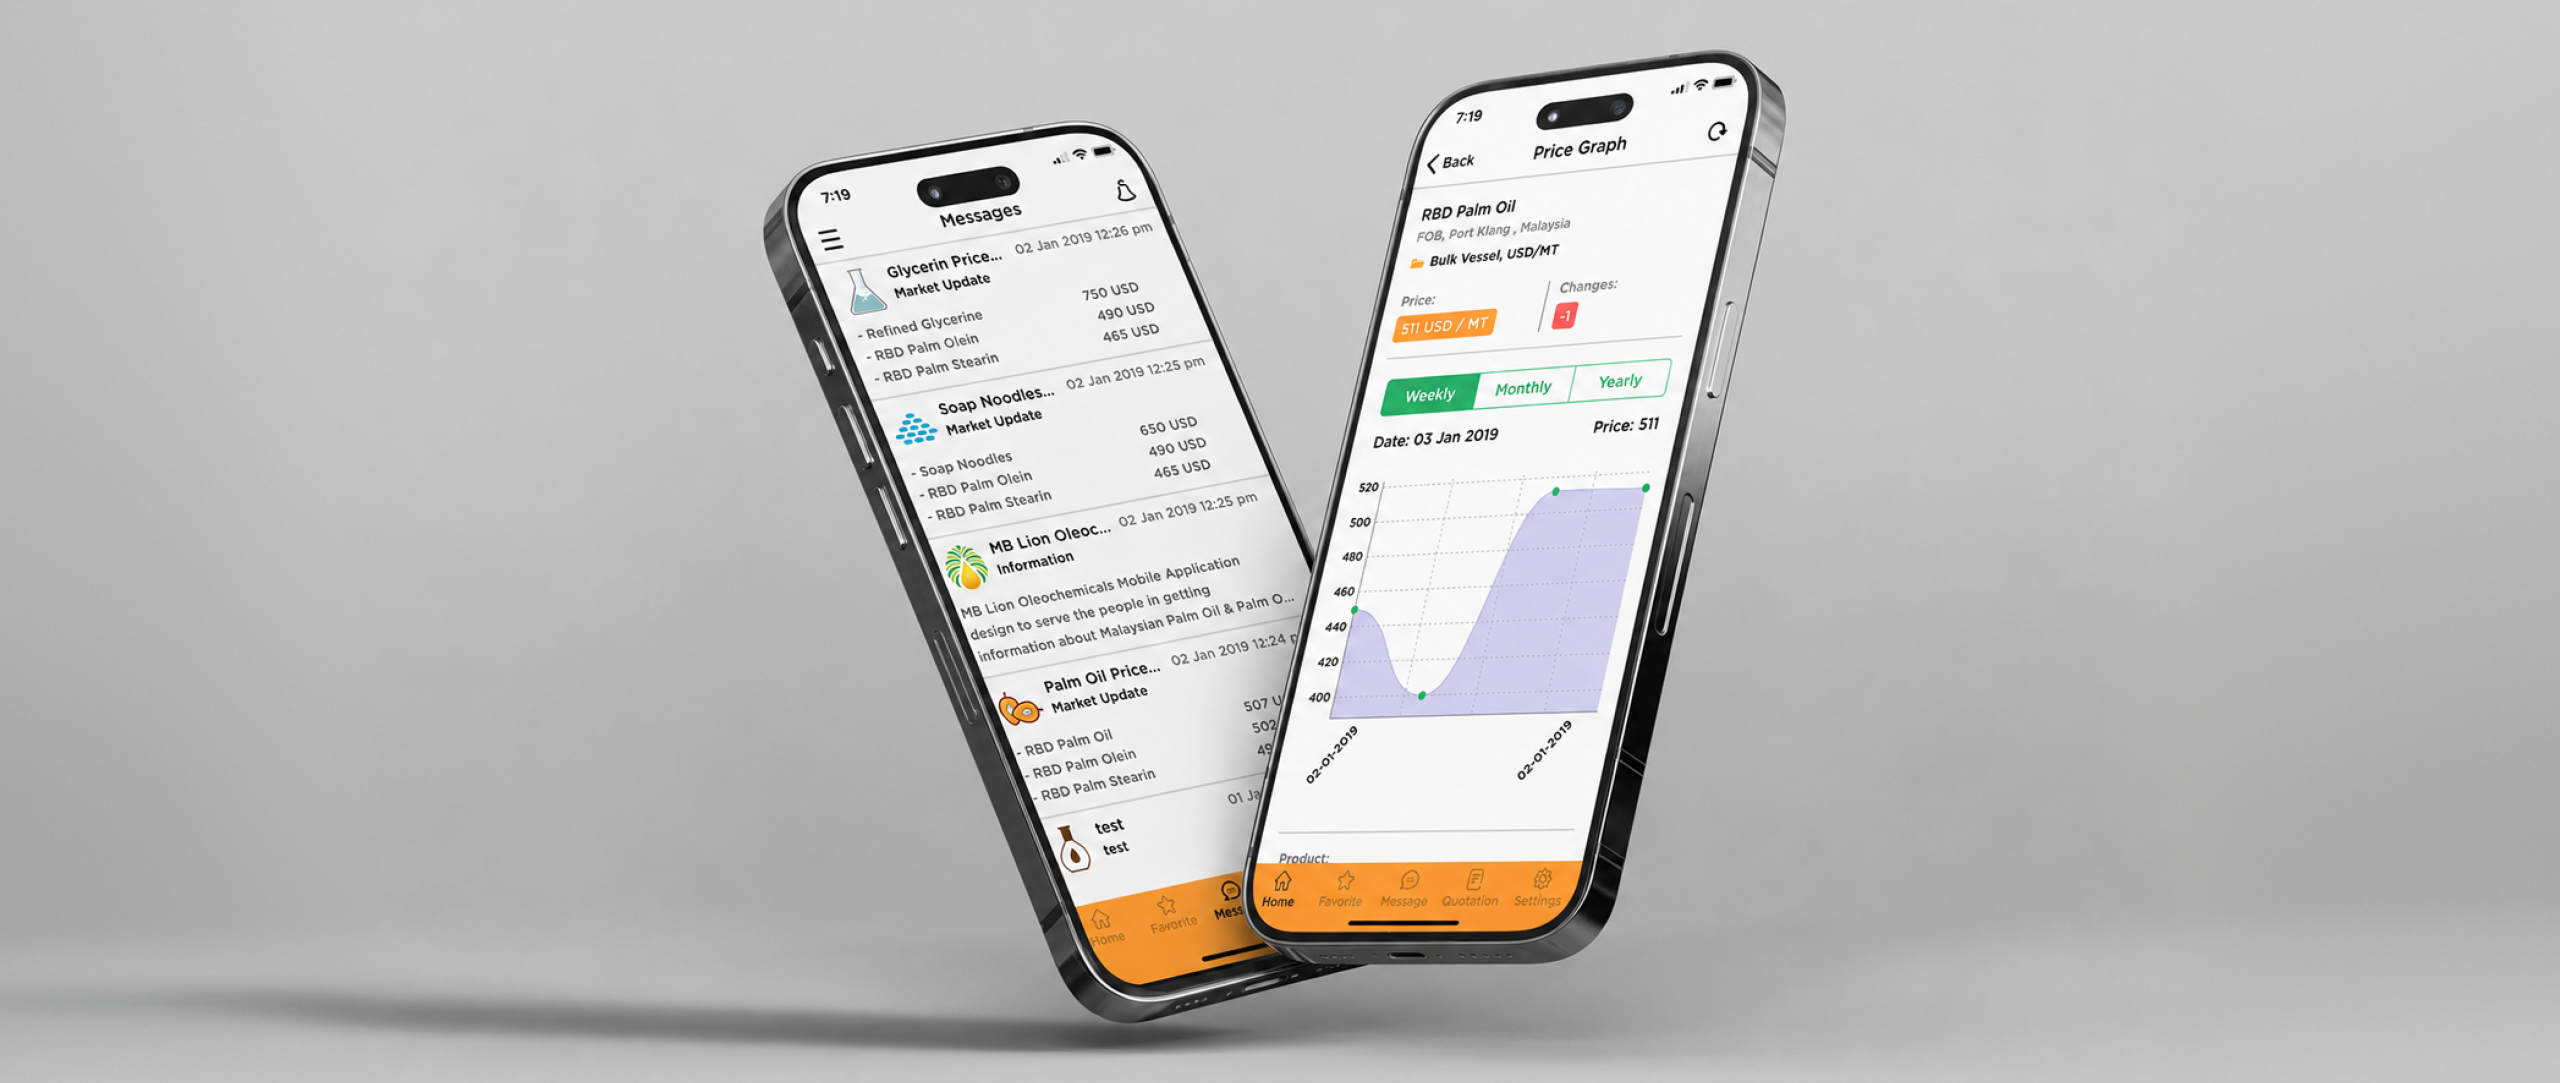
Complex Data Visualization
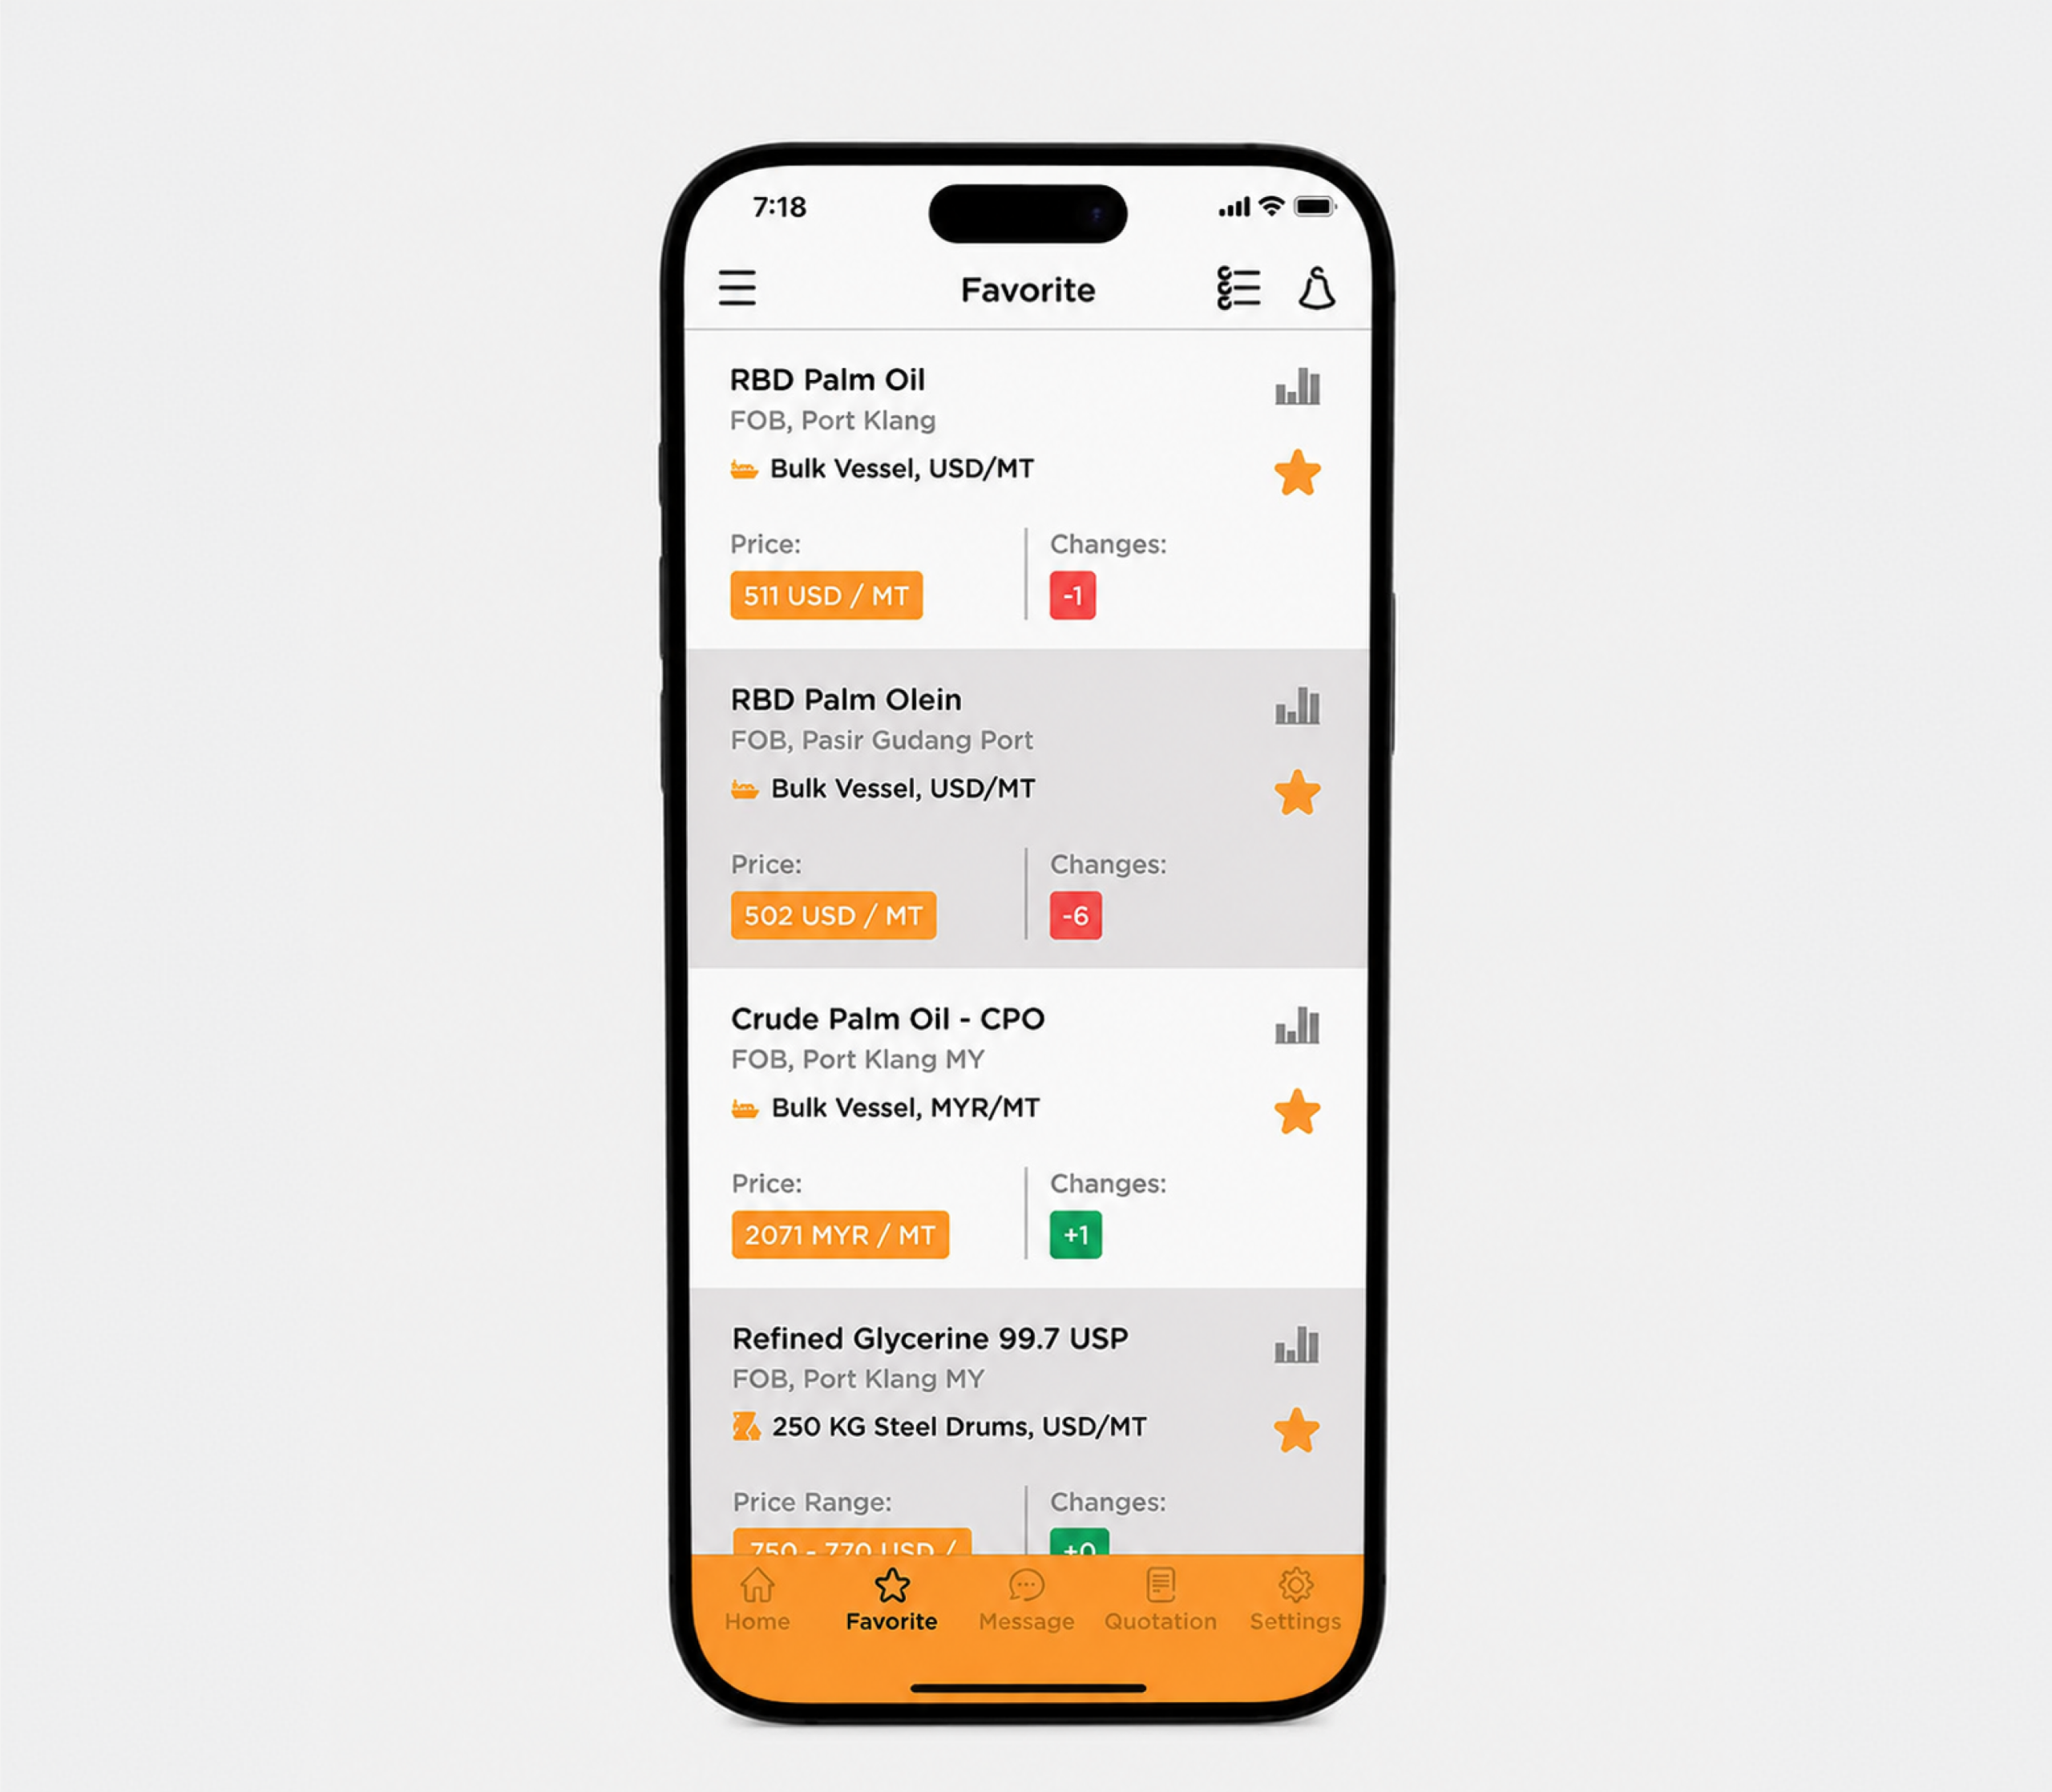
The client struggled to present extensive historical price data in a way that remained intuitive for professional traders, risking user disengagement due to information overload.

Our Solution
We engineered a multi-layered graphical interface that segments price trends into weekly, monthly, and yearly views, allowing users to extract actionable market insights quickly.