Scenario-X
Financial Risk Management Platform
services
AI Product Development
industry
FinTech / Finance
duration
10 Months
country
Switzerland
Project Overview
Scenario-X changes how financial institutes handle financial risks. It helps them turn unsure times into smart chances to grow. Old risk systems use past data and simple math. Scenario-X is different. It uses new AI-Quantum technology. This helps financial institutes see big, rare events coming. It lets financial institutes "make every crisis an opportunity." This system replaces messy, manual ways of checking risks. It's one smart system that combines different tools. It includes scenario modeling, stress testing, and following rules. Financial institutes can now do advanced risk checks. They can do basic VaR calculations or complex quantum simulations. All of this happens on one system. Scenario-X changes risk management from just reacting to problems to actively predicting them. The system's AI constantly checks market conditions and new rules. It also looks at each financial institute's unique risks. It gives real-time information and helpful advice. This helps risk managers, wealth advisors, traders, and compliance officers. They can make smart, fast decisions based on data.
Challenges
Scale and Complexity of Financial Data
Interactive and Insightful Visualizations
Regulatory and Usability Balance
Our Solution
Efficient Data Management
Dynamic and Scalable Charting
Clarity, Transparency, and Accessibility
Features Implemented
Scenario-X delivers a comprehensive suite of financial risk management tools. Each feature is purpose-built for specific risk analysis, regulatory compliance, and portfolio management needs.
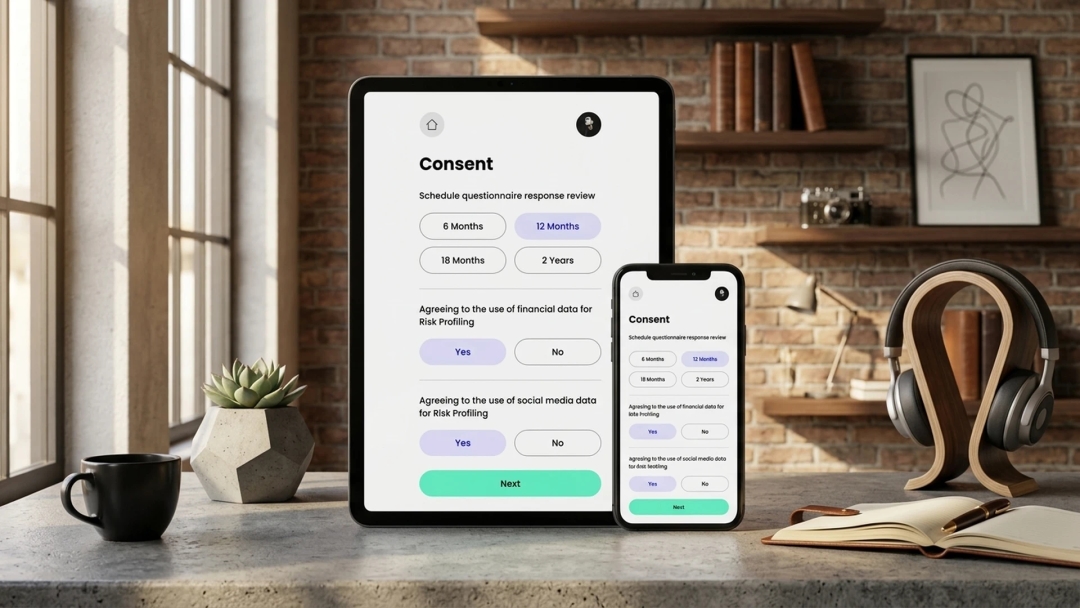
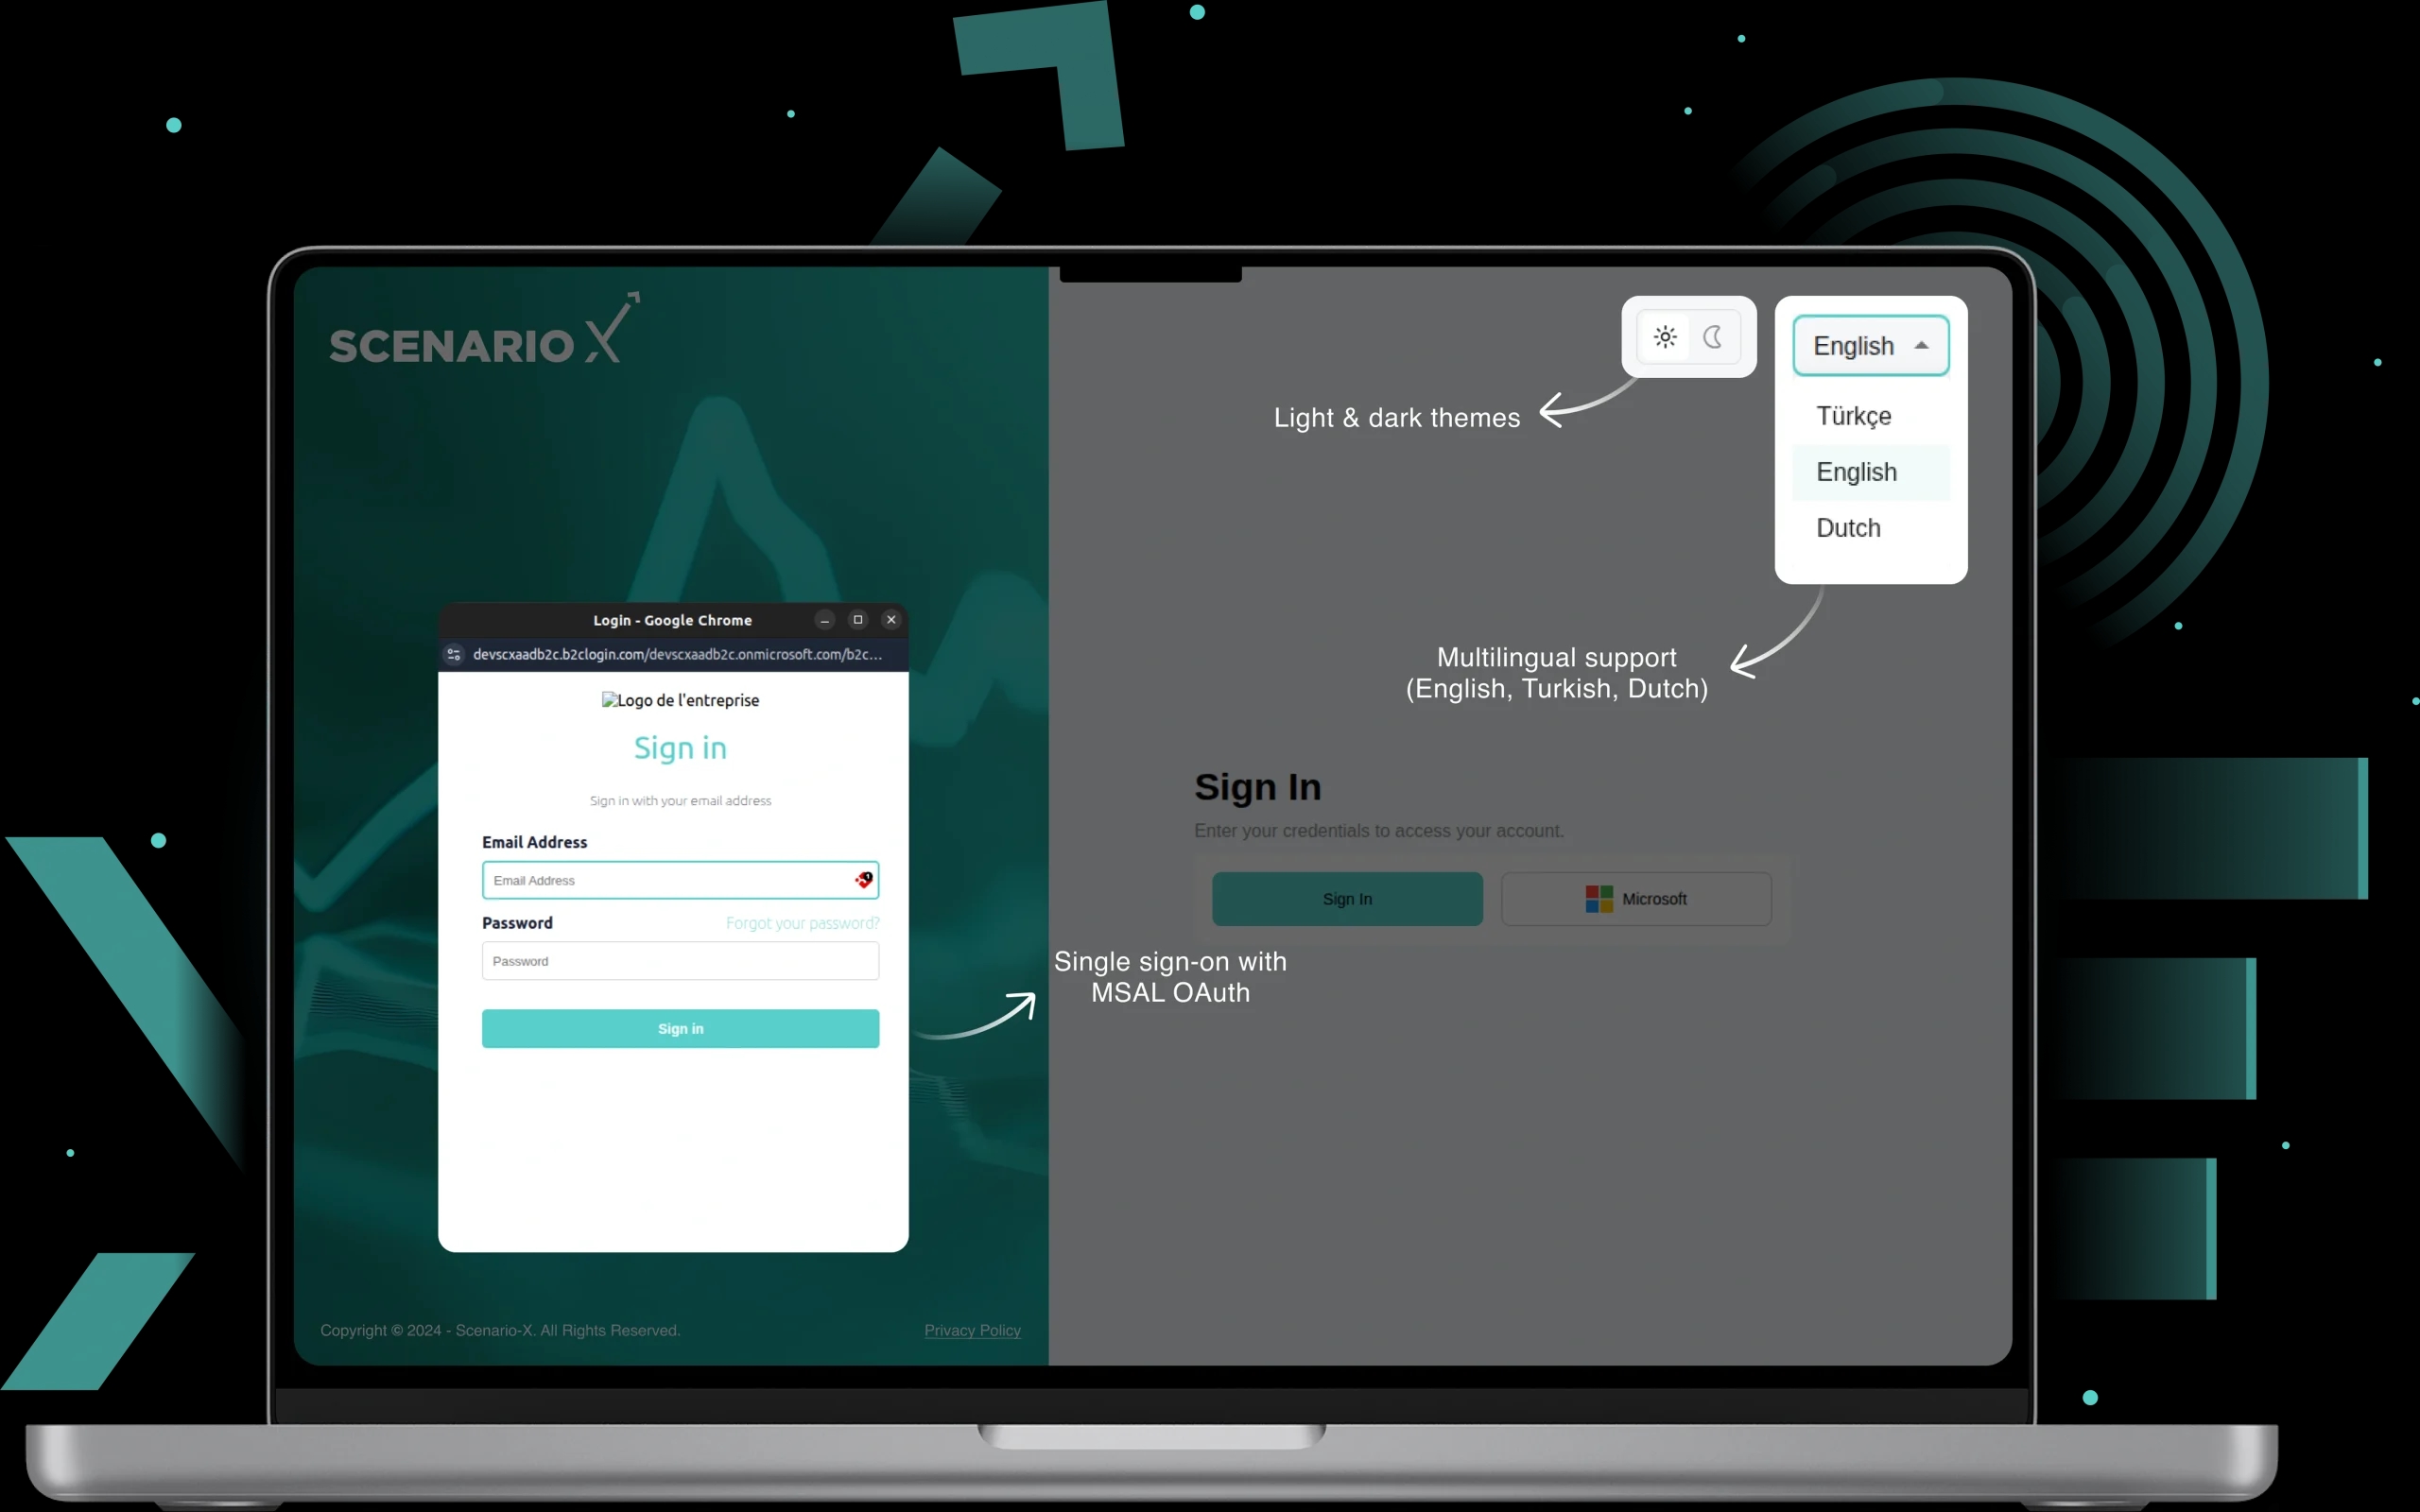
1. Authentication along with multilingual support
We implemented strong security by using MSAL OAuth. This allows a single login that works smoothly with a company's current identity systems. The platform lets users log in using different languages like English, Turkish, and Dutch. It also has light and dark screen themes that stay the same each time a user logs in. Advanced controls based on roles let administrators manage user profiles. This is for people like compliance officers, risk managers, and analysts. Each role gets specific permissions for their tasks. Real-time session management includes automatic logouts, checking for many logins at once, and instant security alerts for strange activities.
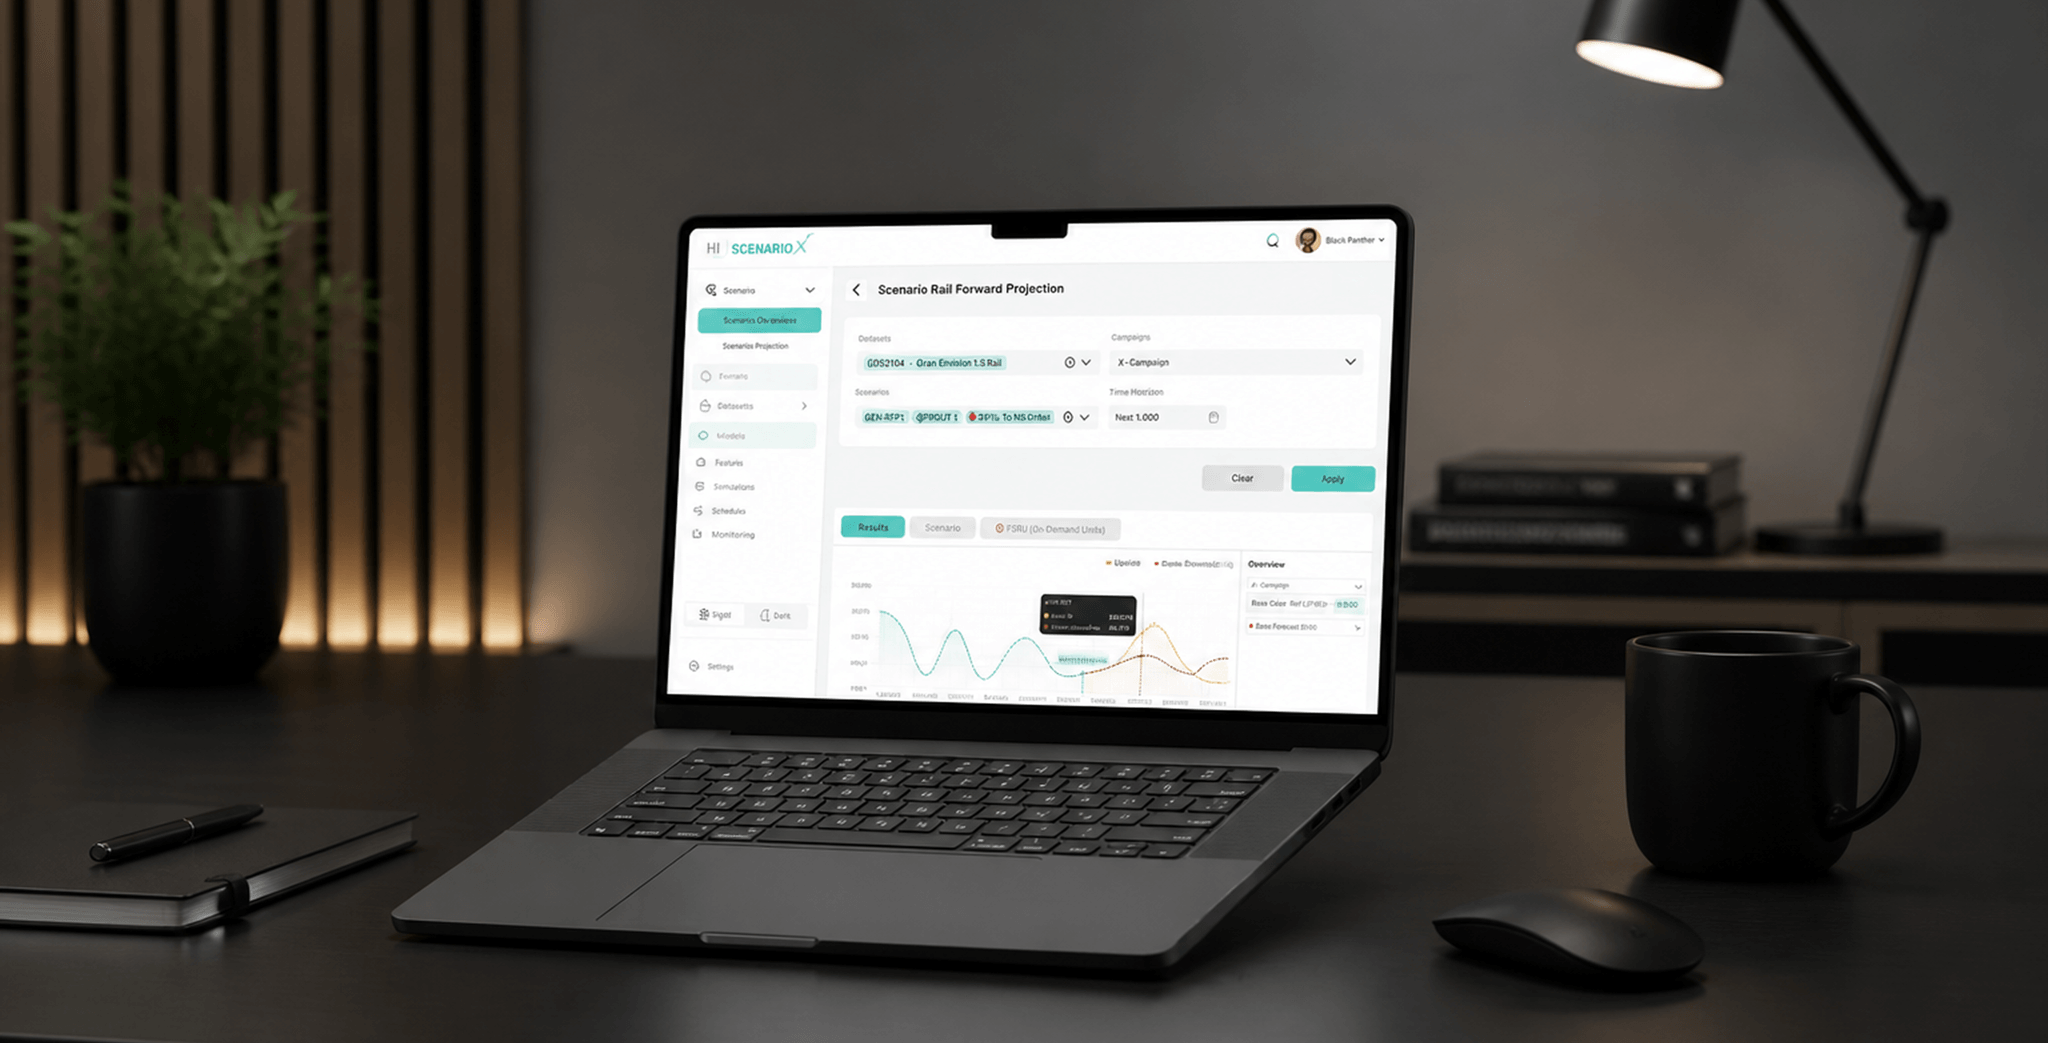
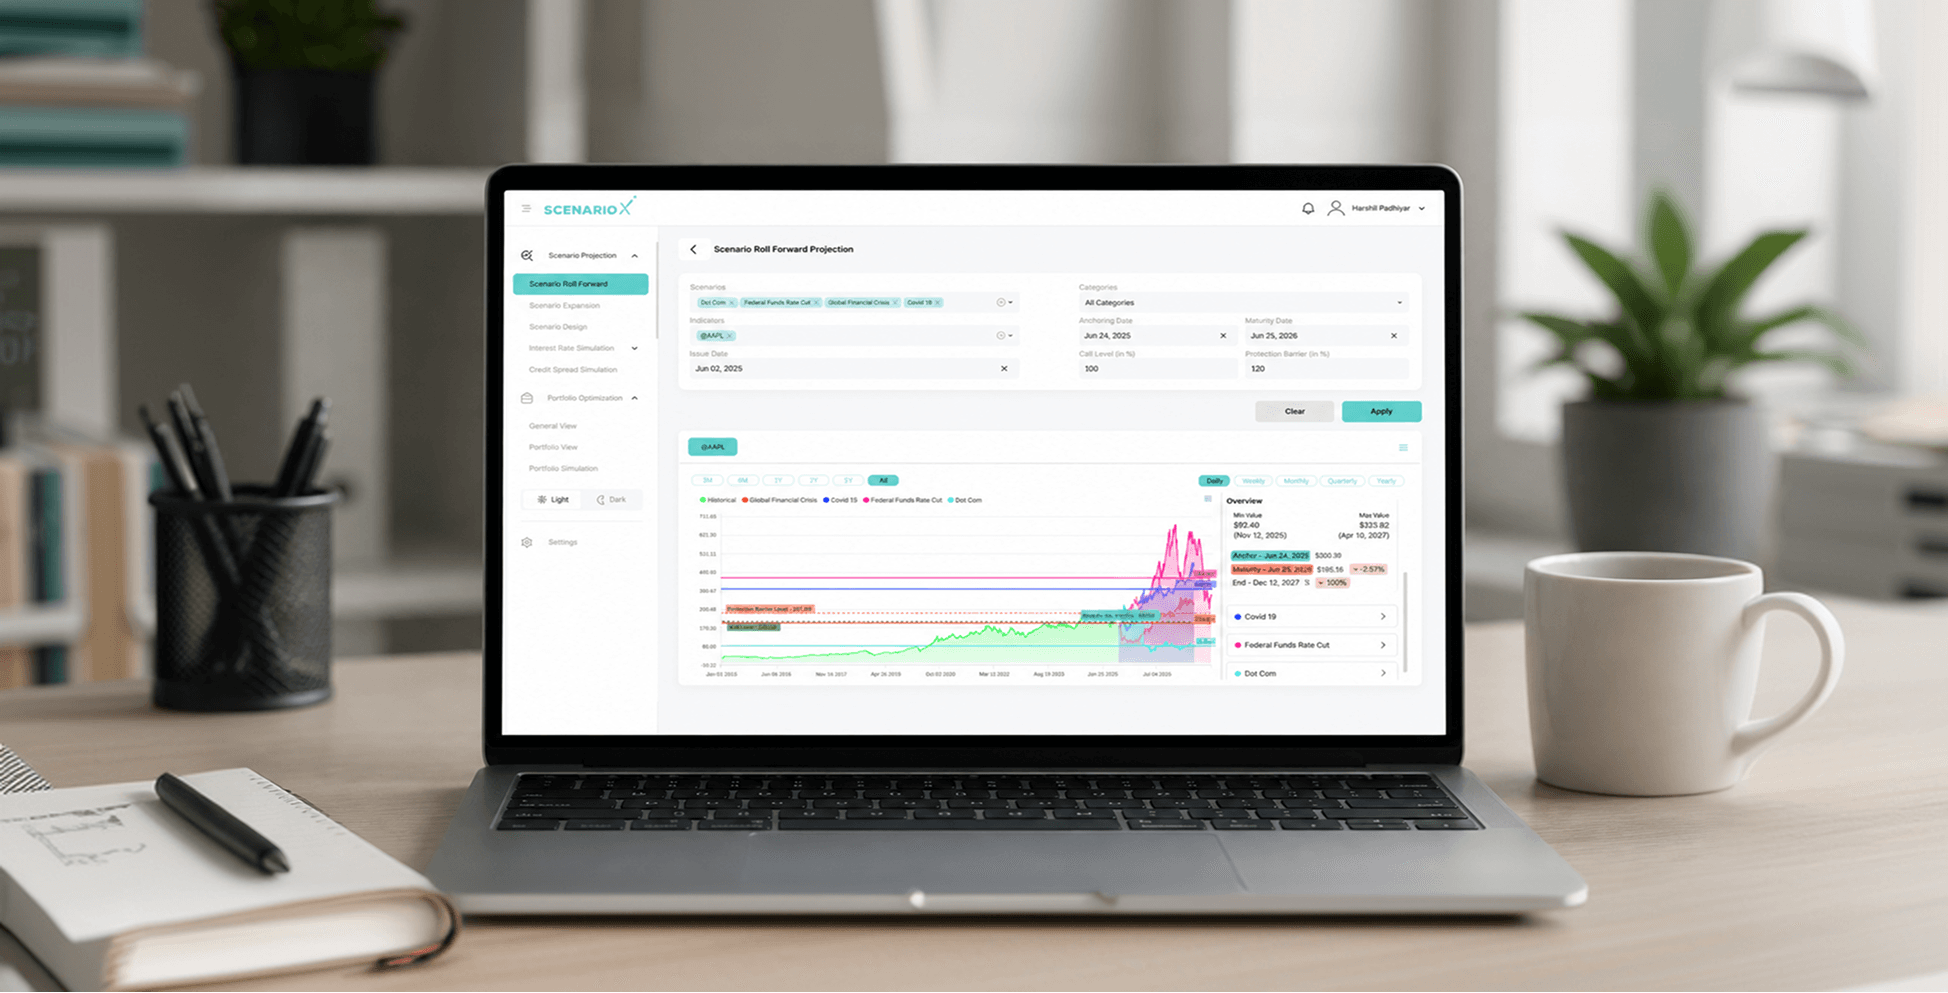
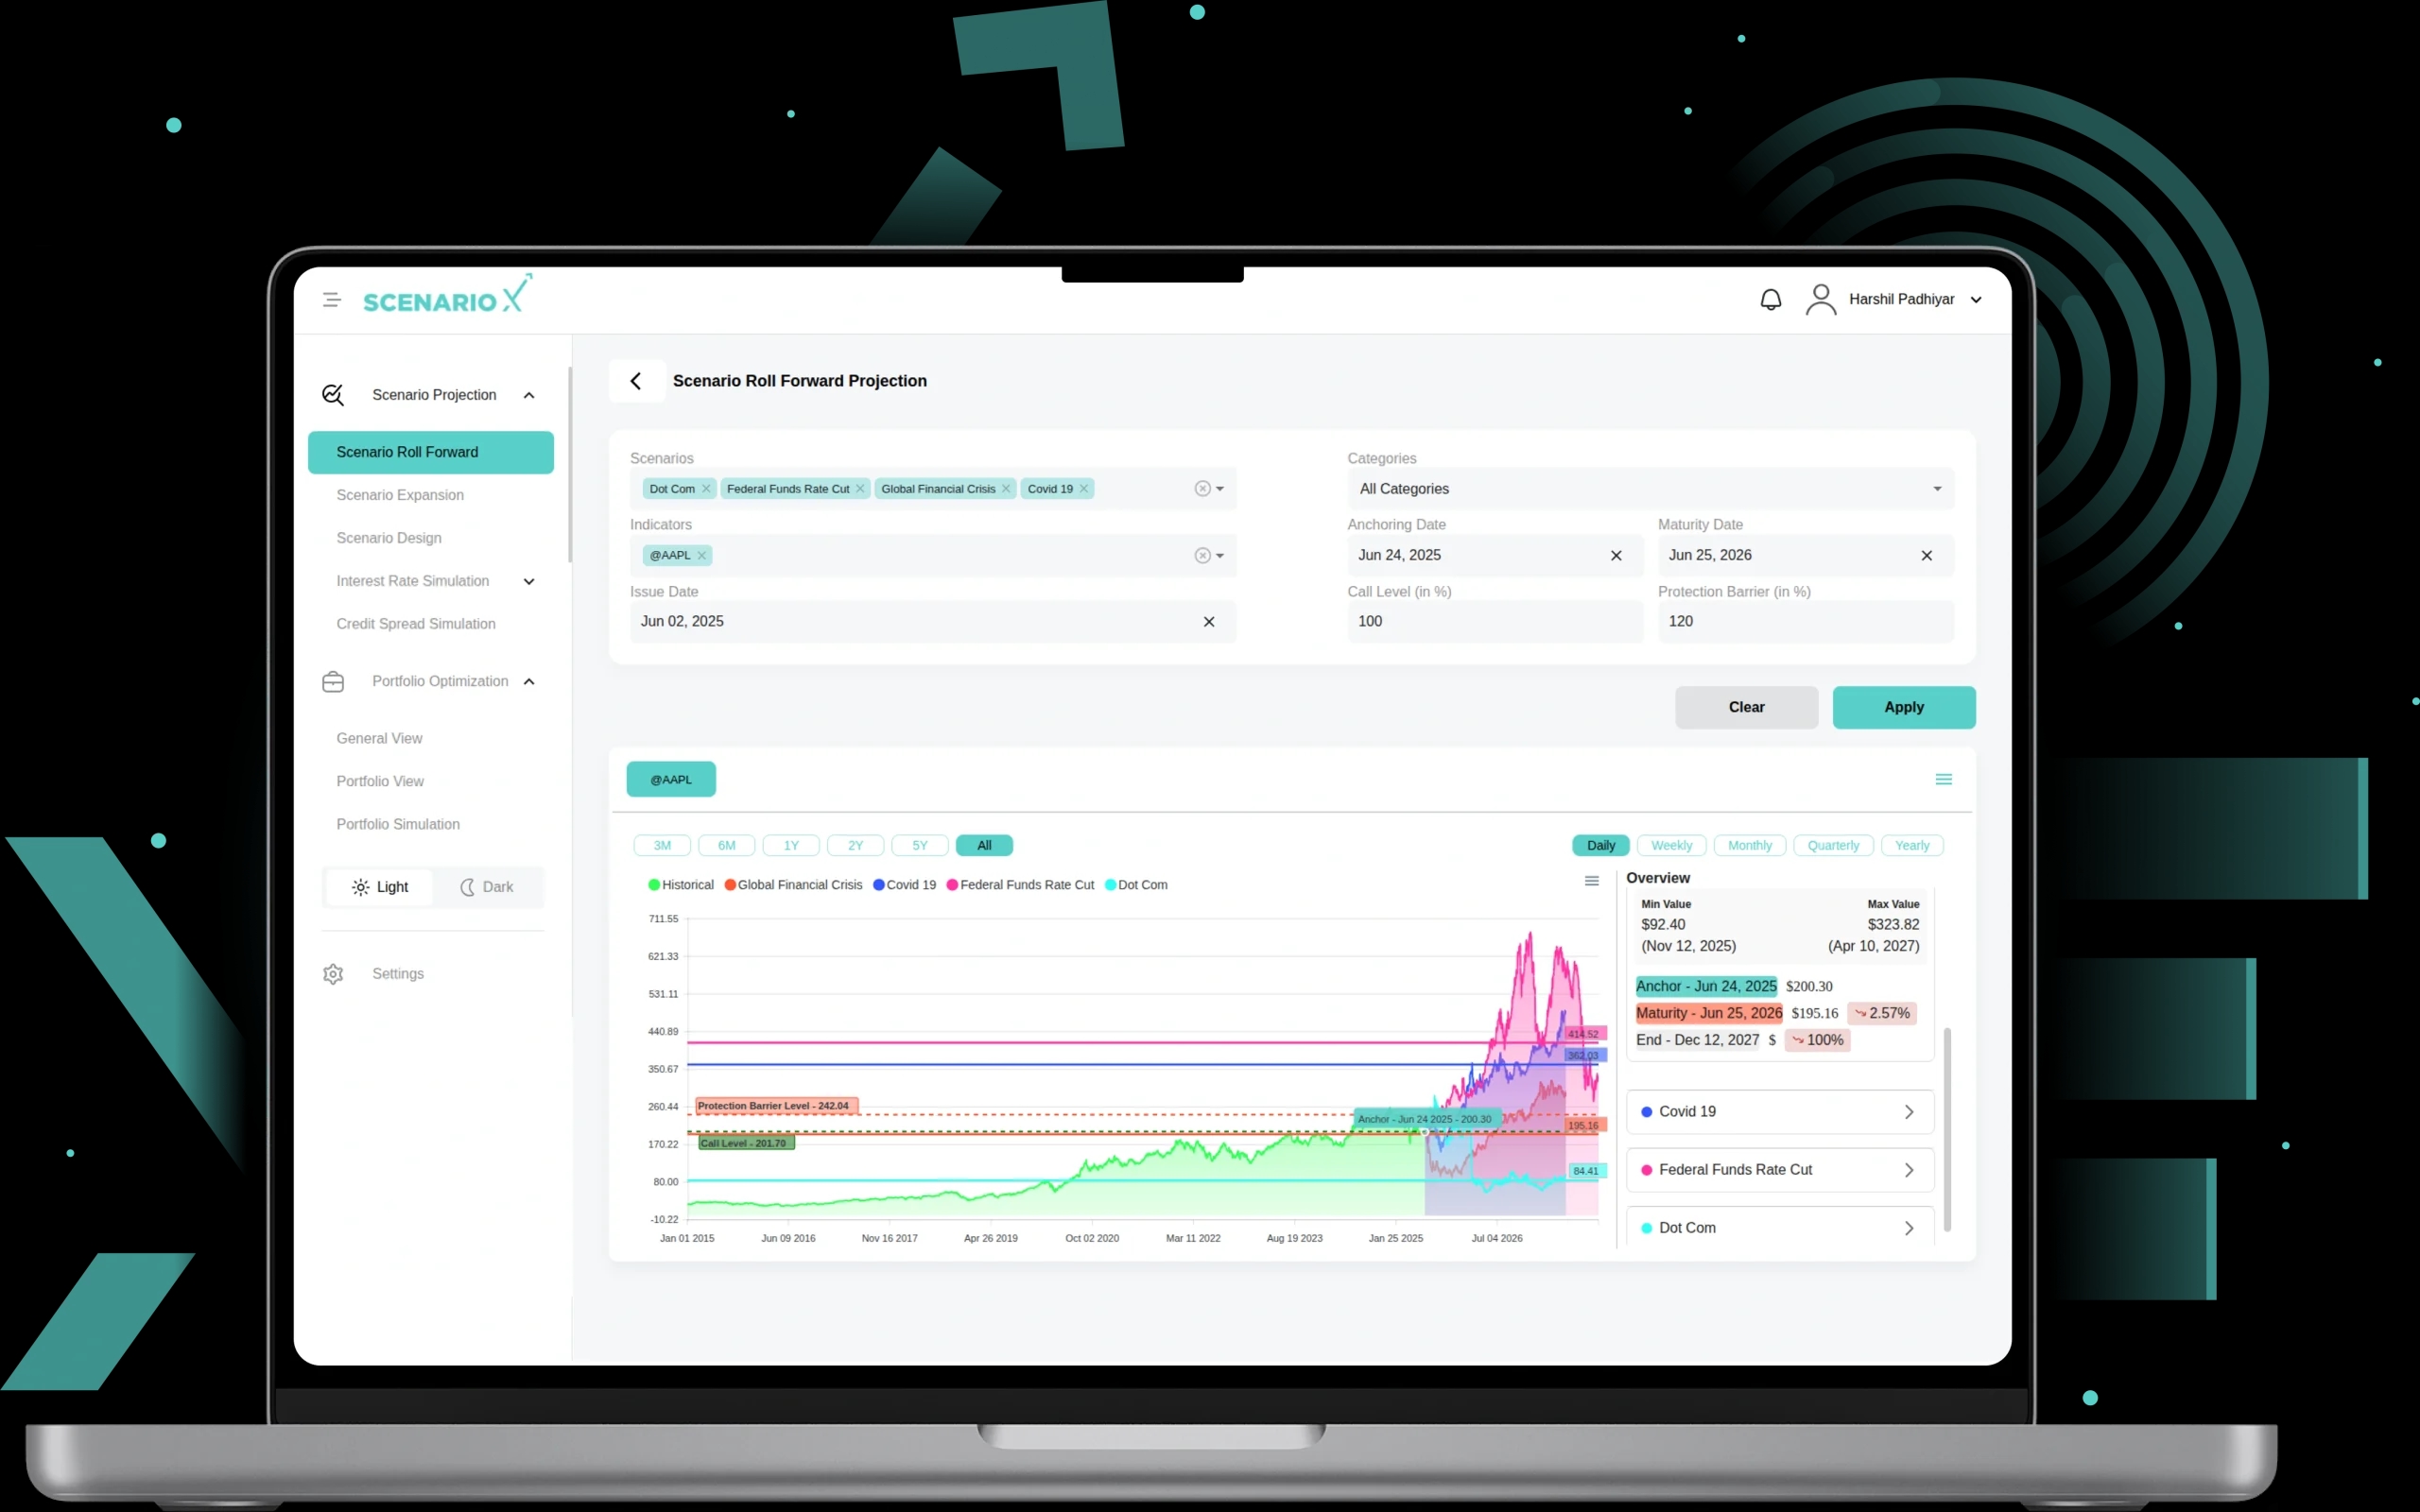
2. Scenario Roll Forward
This uses past scenarios like financial crises, like the Dot Com Bubble, the 2008 financial crisis, and COVID-19. It checks how these events might affect today's investments. Special models capture sudden market changes. Users can make their own custom scenarios. They can set different rules, date ranges, and indicators. Interactive charts show how risk changes over time, using colors to highlight key periods. This helps companies find risky times and check how strong their investments are during different market conditions.
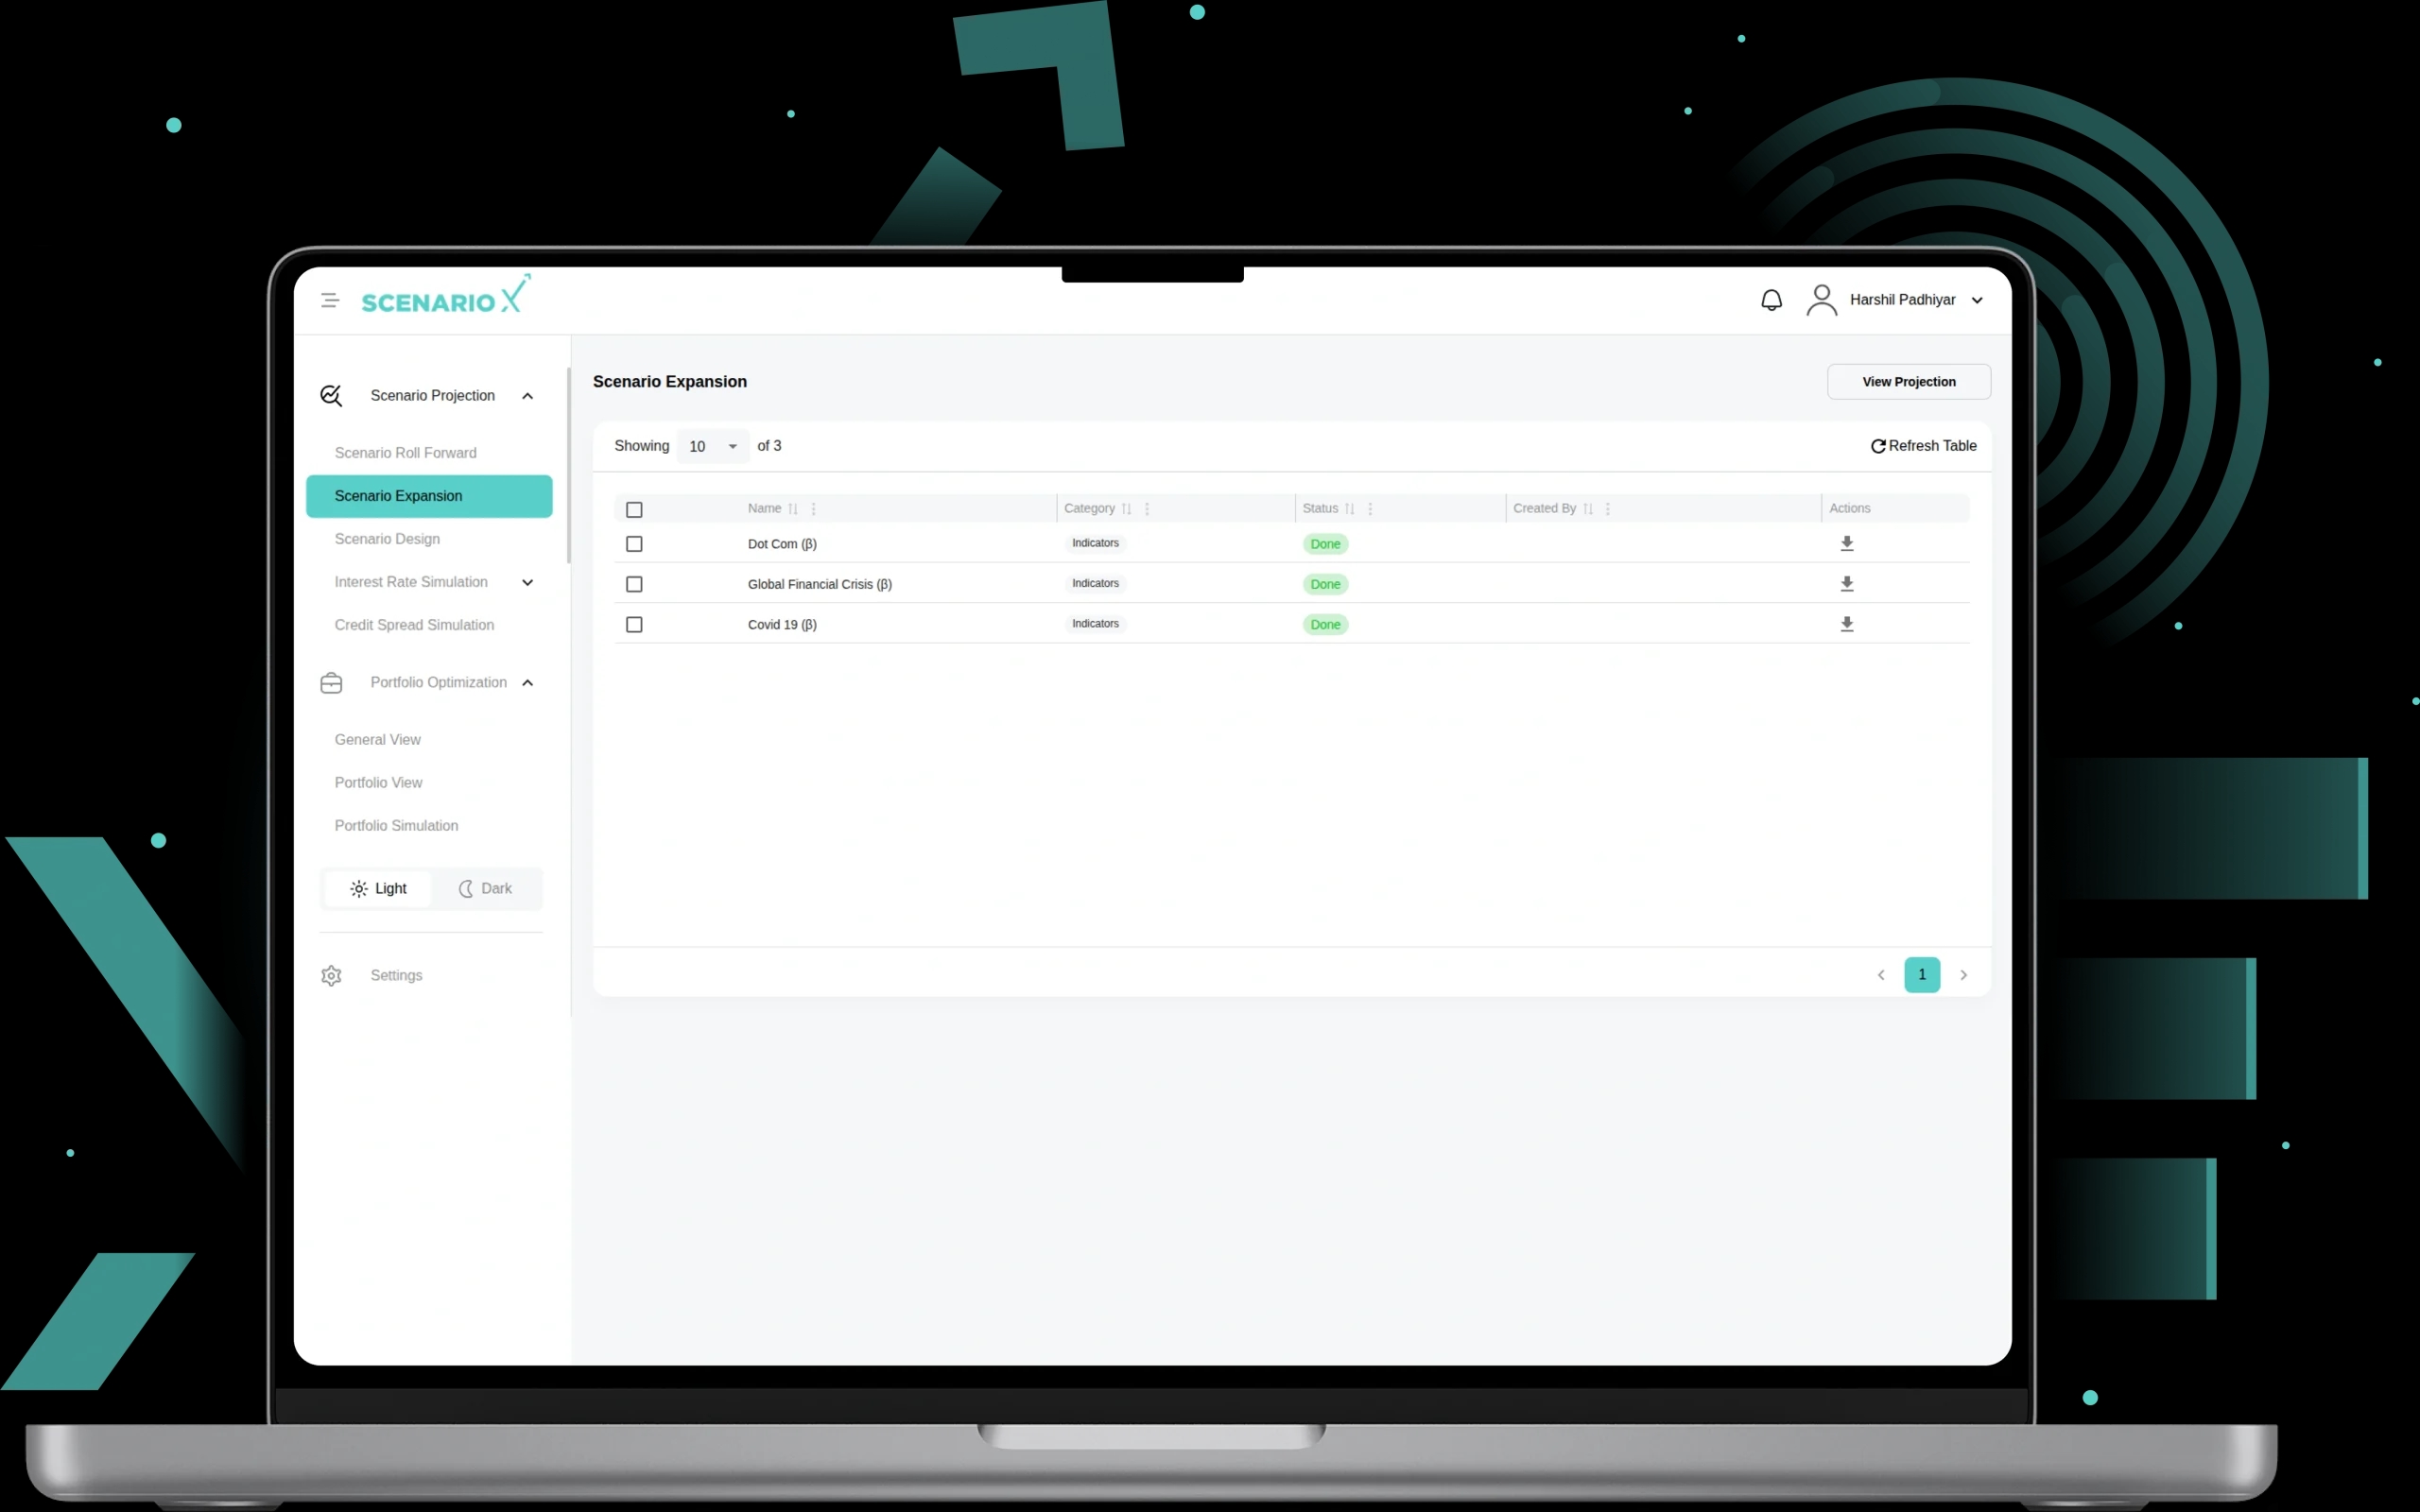
3. Scenario Expansion
This adds more to regulatory scenarios. It includes extra economic and financial factors. It also adjusts for market changes in real time. The system can look at many scenarios at once. It combines past events with custom indicators. You can set flexible rules like start dates, call levels, and safety limits. It also automatically calculates future projections for different time periods. It has strong tools for filtering and showing data. This helps meet rules better and assess risks.
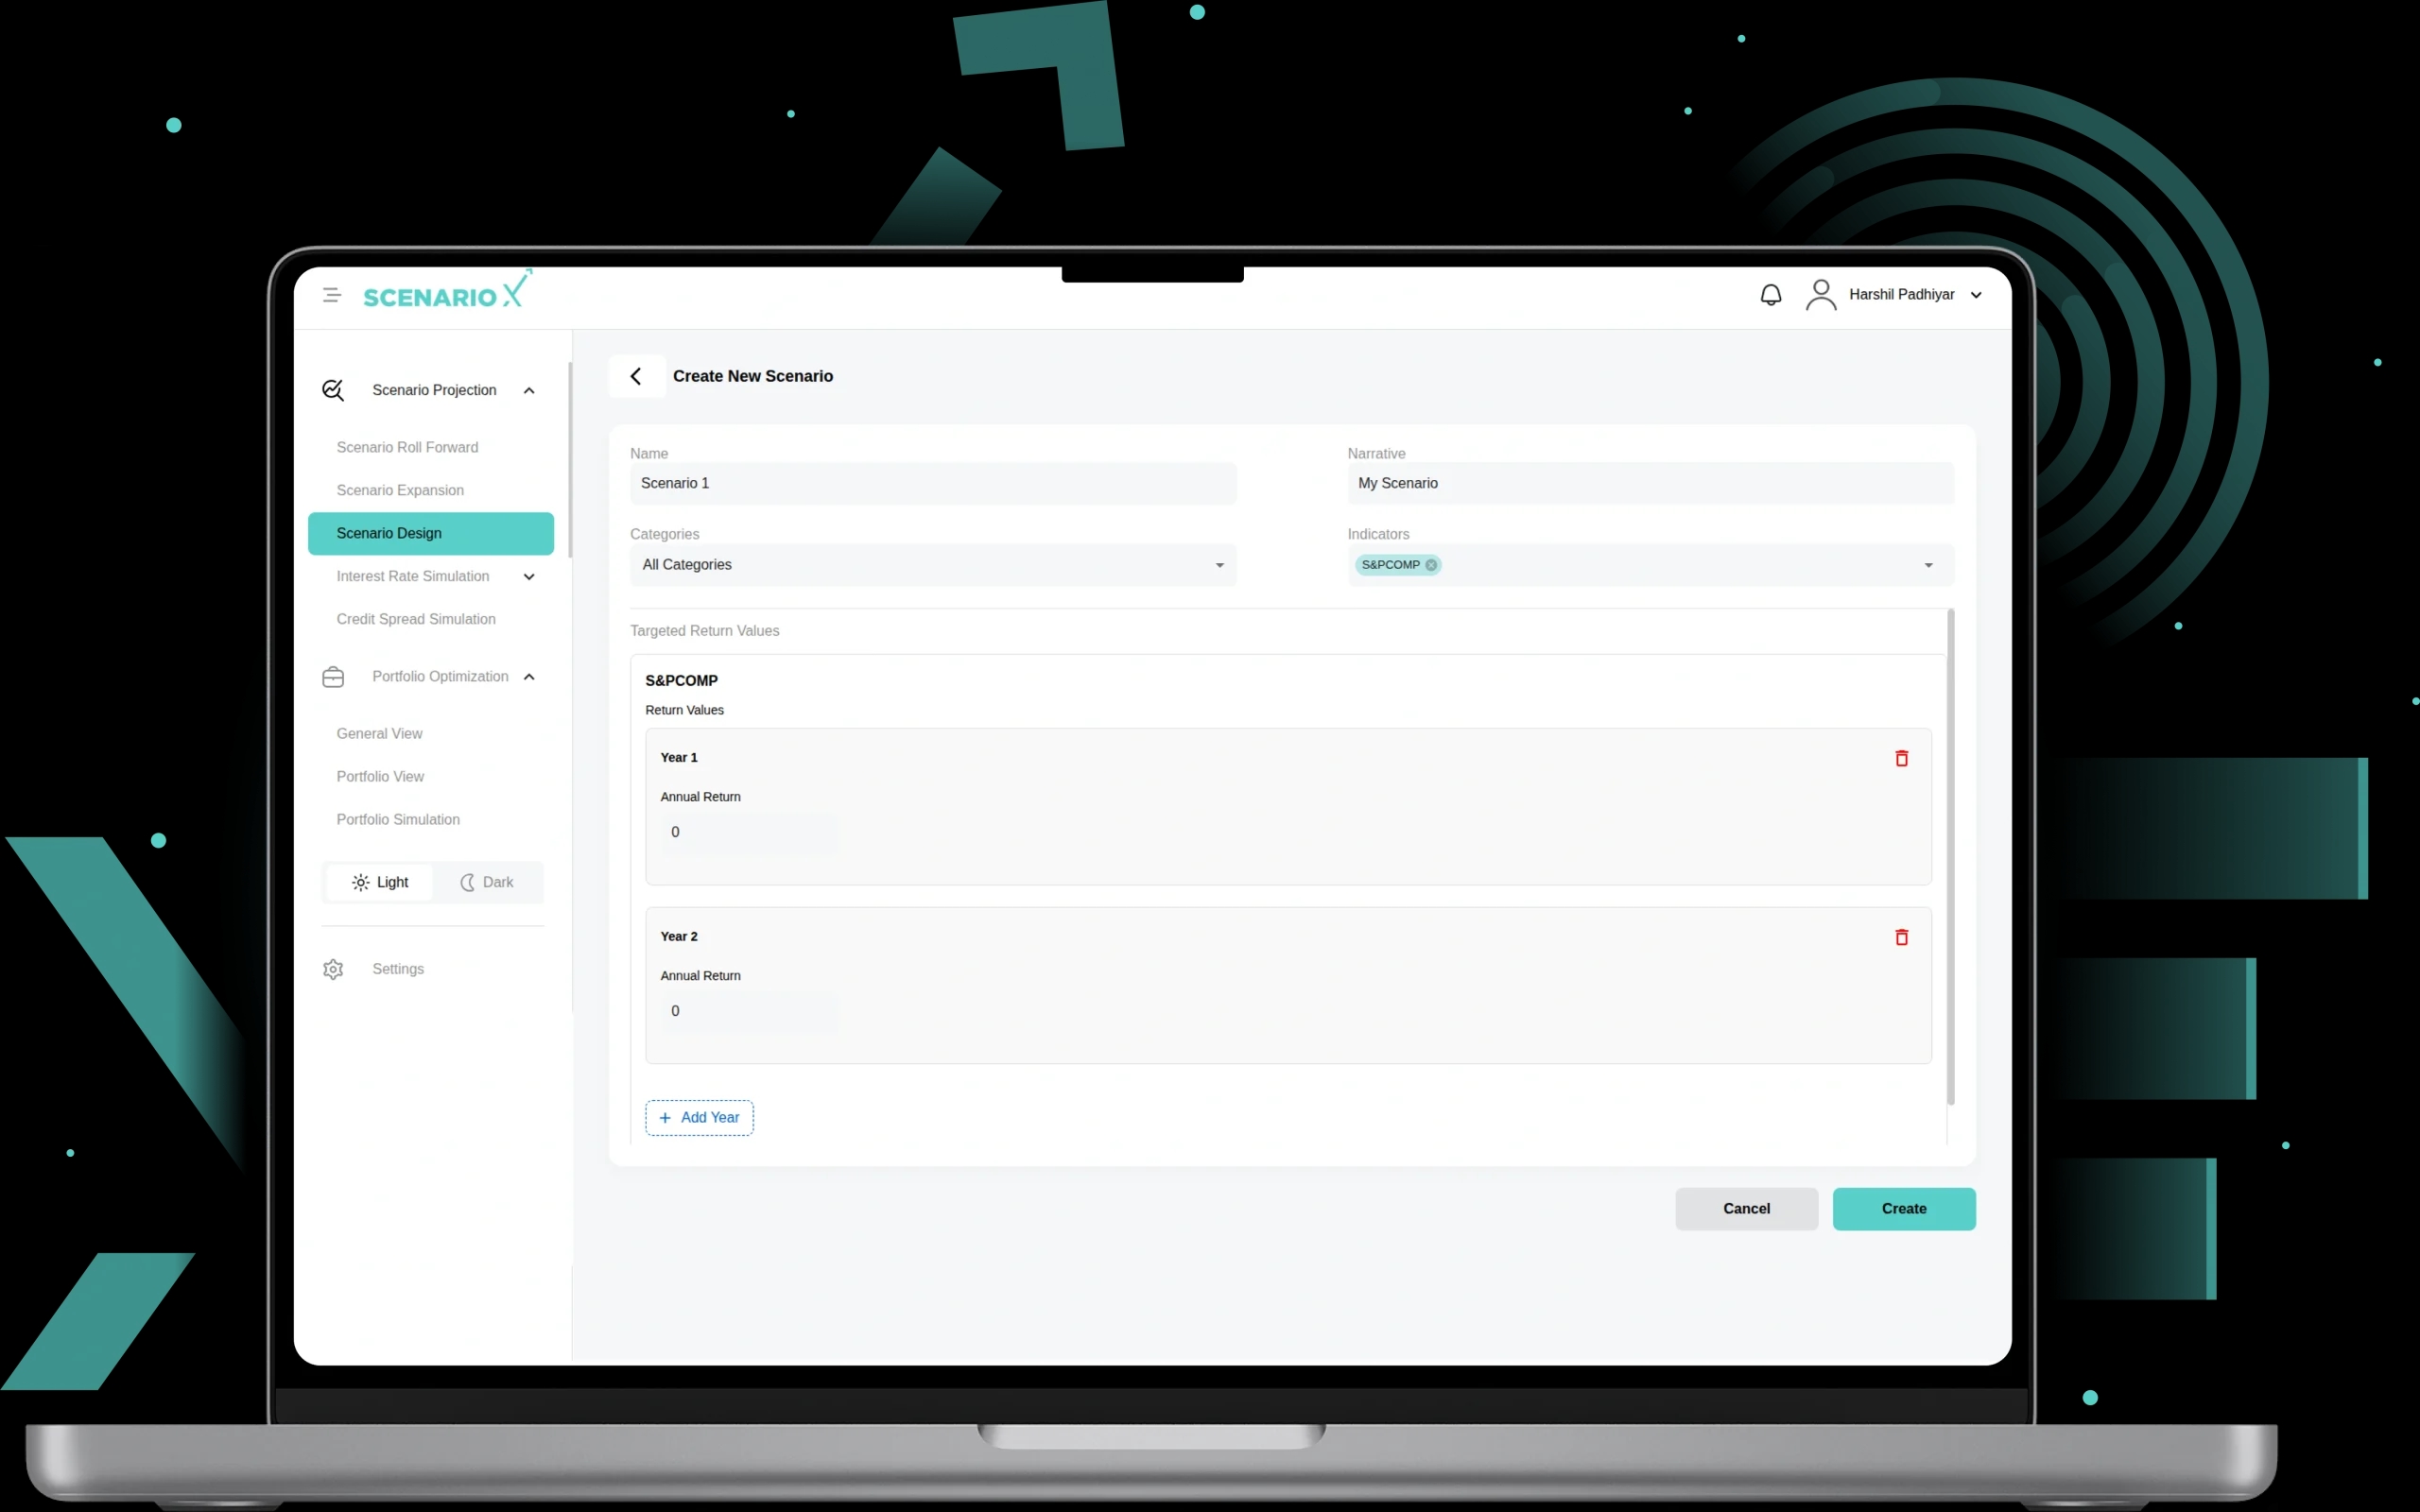
4. Scenario Design
This lets users make their own scenarios. These can be for specific market worries, world events, elections, or conflicts. They match the unique risks of each company. The system has many ready-made scenarios. These include scenarios like Dynamic Base Case, Dynamic Severe Downside, and SAB regulatory scenarios. It also has tools to design new scenarios. You can set rules, predict returns over many years, assign indicators, and set call levels and safety limits.
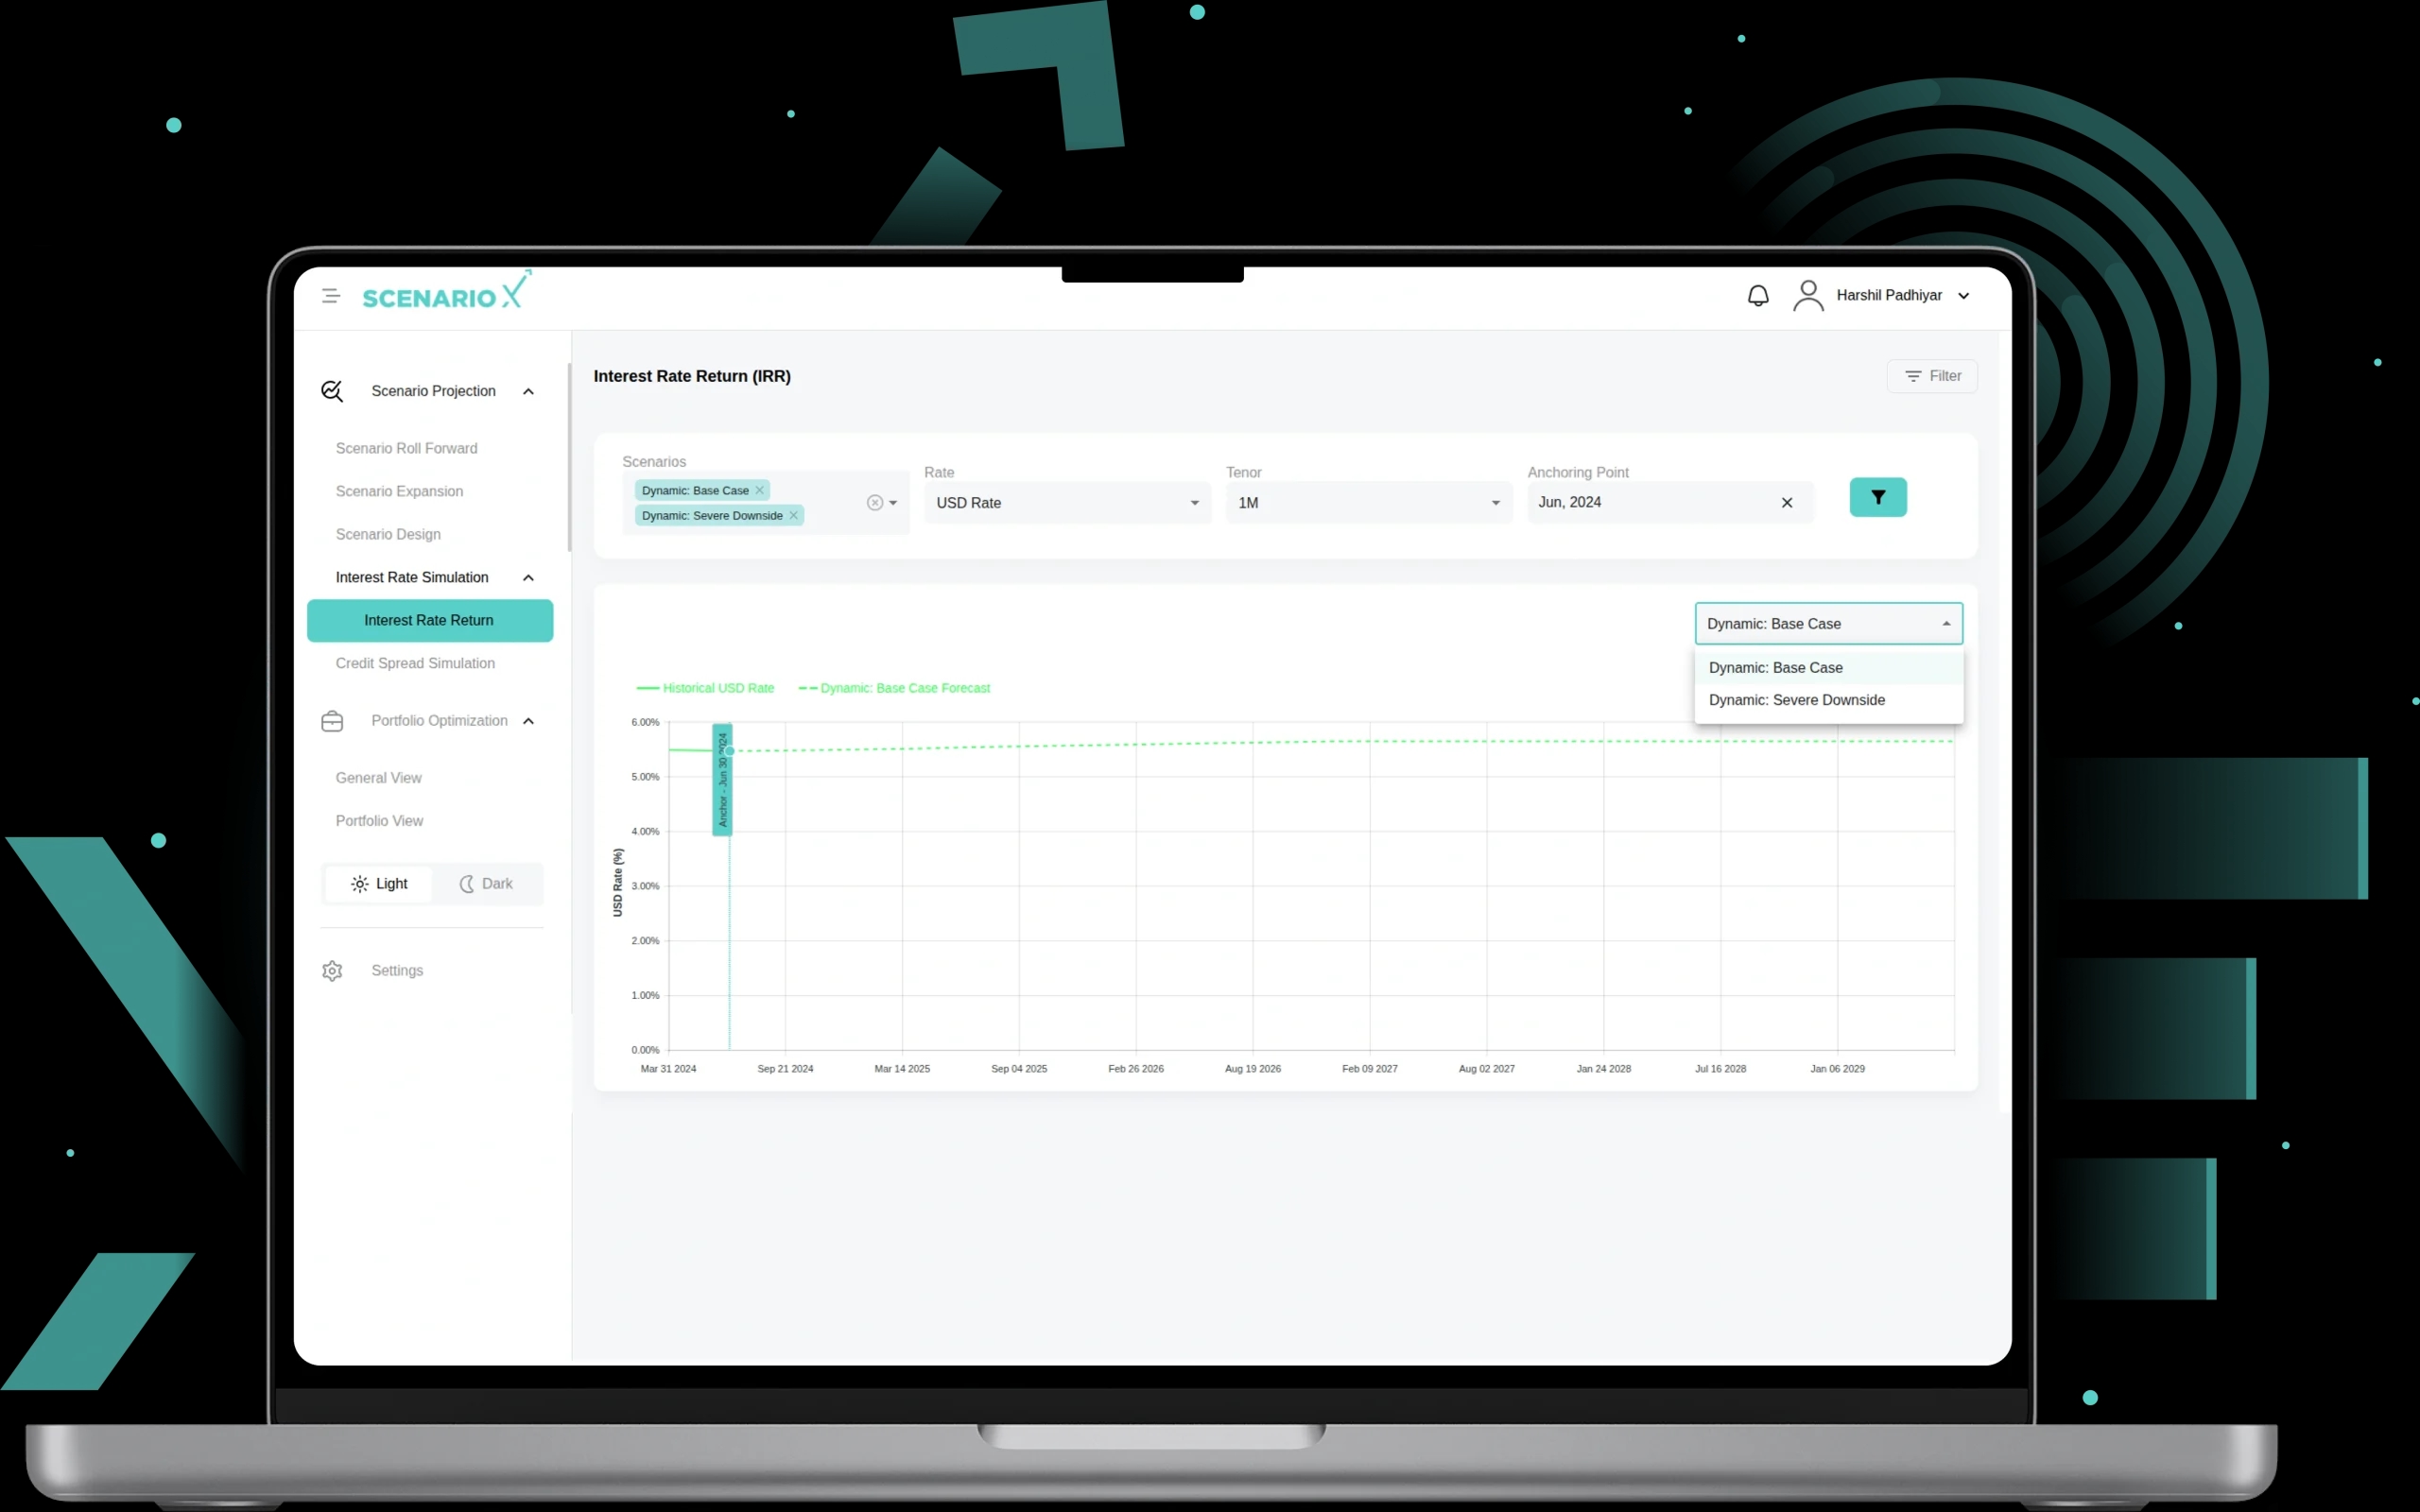
5. Interest Rate Return (IRR)
Interest Rate Return lets you simulate and predict interest rates. It uses scenarios, different rate types, and time periods. You can also pick a starting point. It shows a clear comparison of past and future rates. This helps manage interest rate risk and follow rules.
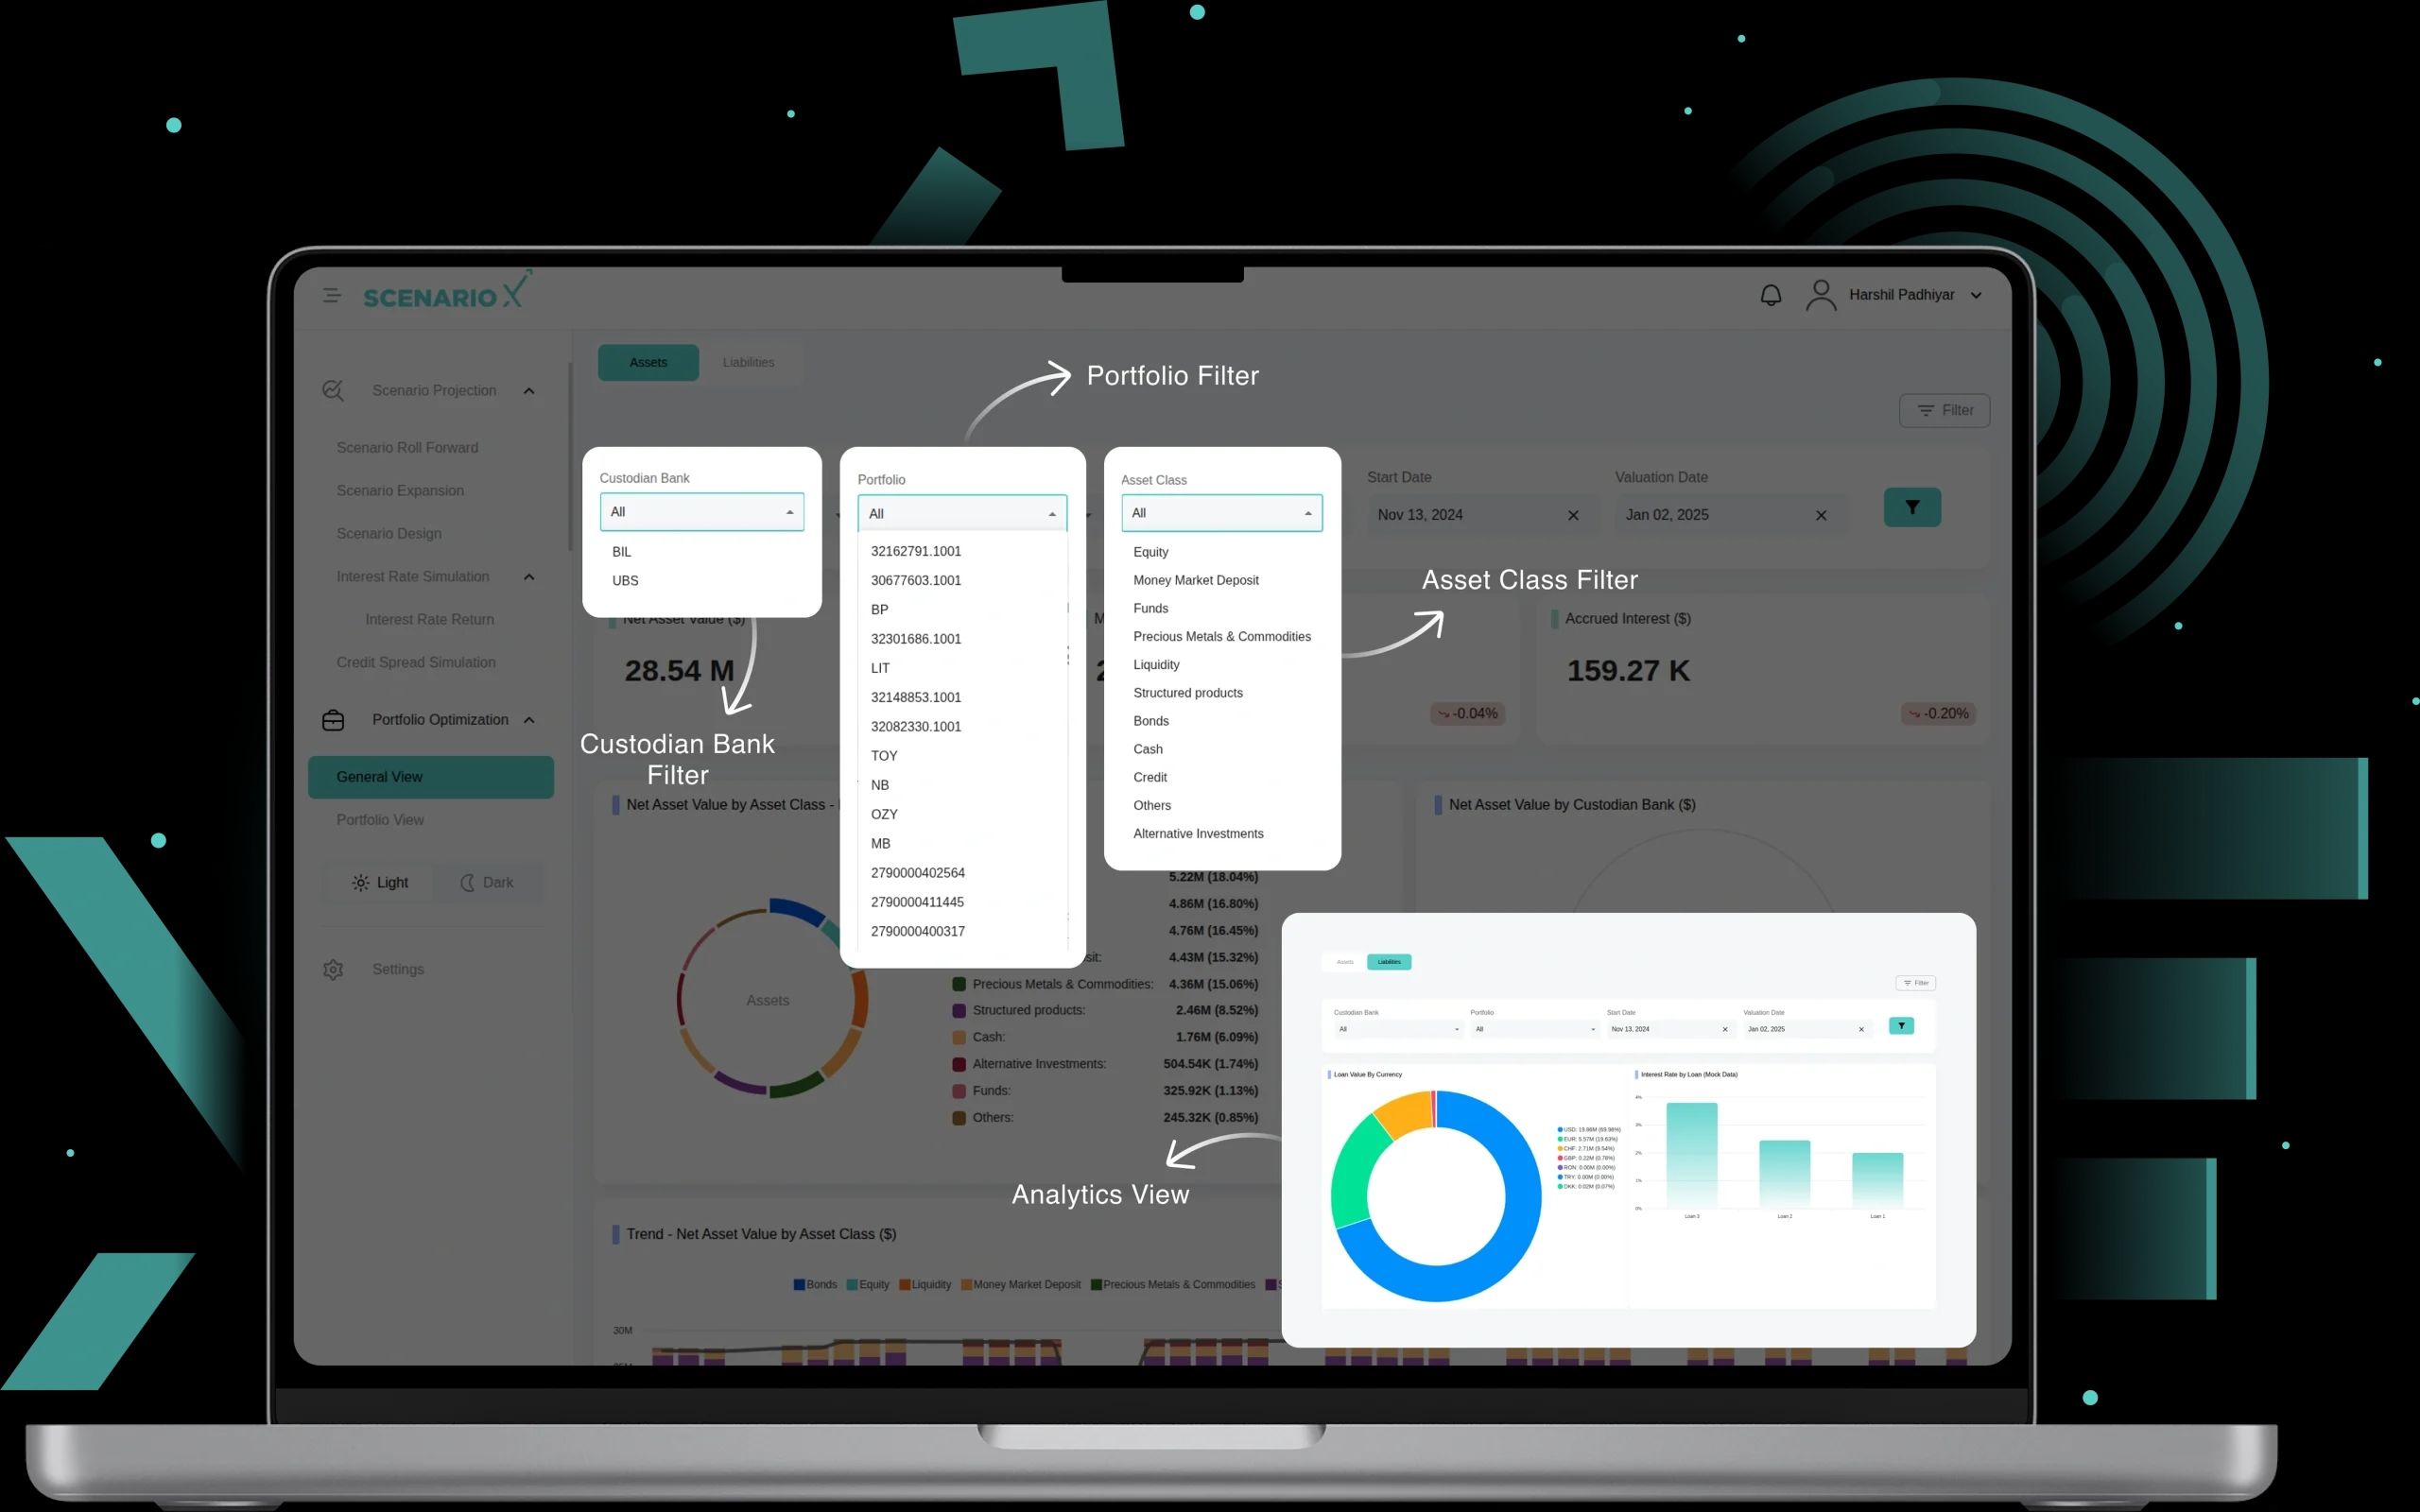
6. General View
Comprehensive portfolio analytics with multi-dimensional asset and liability analysis, including net asset values, market values, accrued interest calculations, asset class breakdowns, trend analysis over time, portfolio securities distribution, currency exposure analysis, and detailed tabular data with filtering capabilities for holistic portfolio management and performance monitoring.
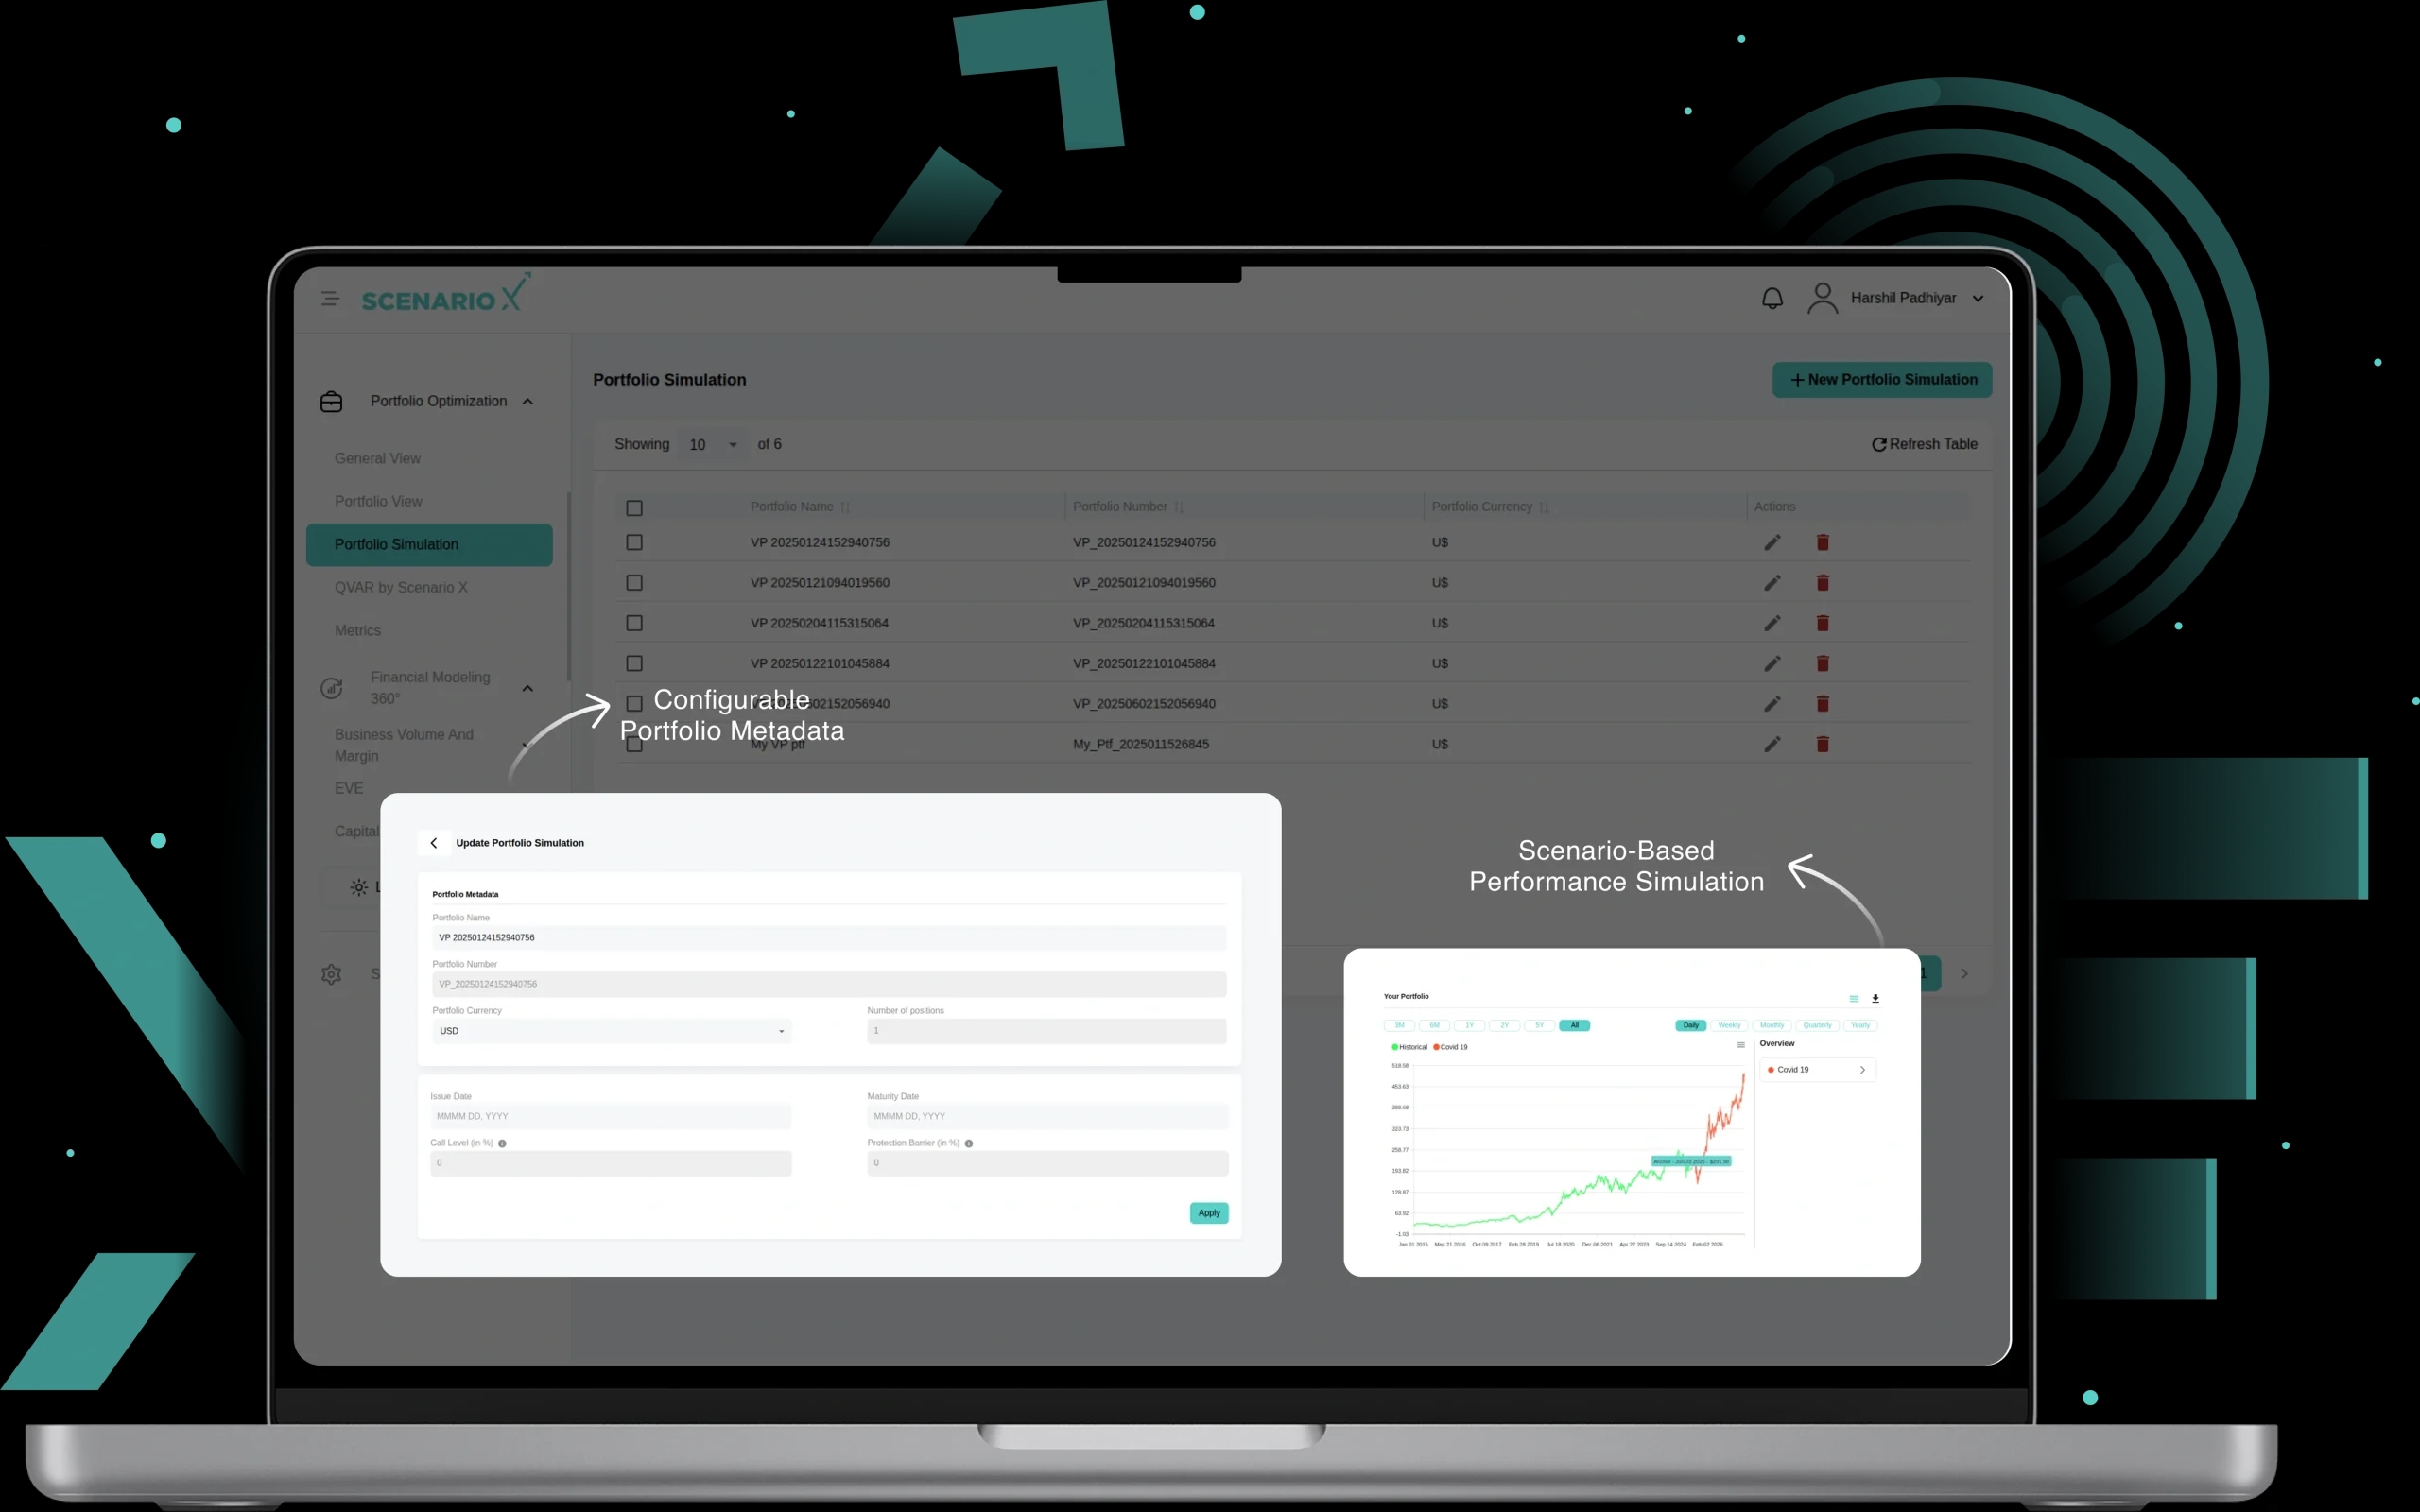
7. Portfolio Simulation
Users can create and manage virtual portfolios with configurable metadata including portfolio names, numbers, currencies, issue dates, maturity dates, call levels, and protection barriers. The module supports bulk securities upload (JSON format), security input with quantities, scenario assignment, anchoring point selection, and real-time simulation execution with interactive visualization comparing historical data versus scenario projections for comprehensive portfolio stress testing and risk analysis.
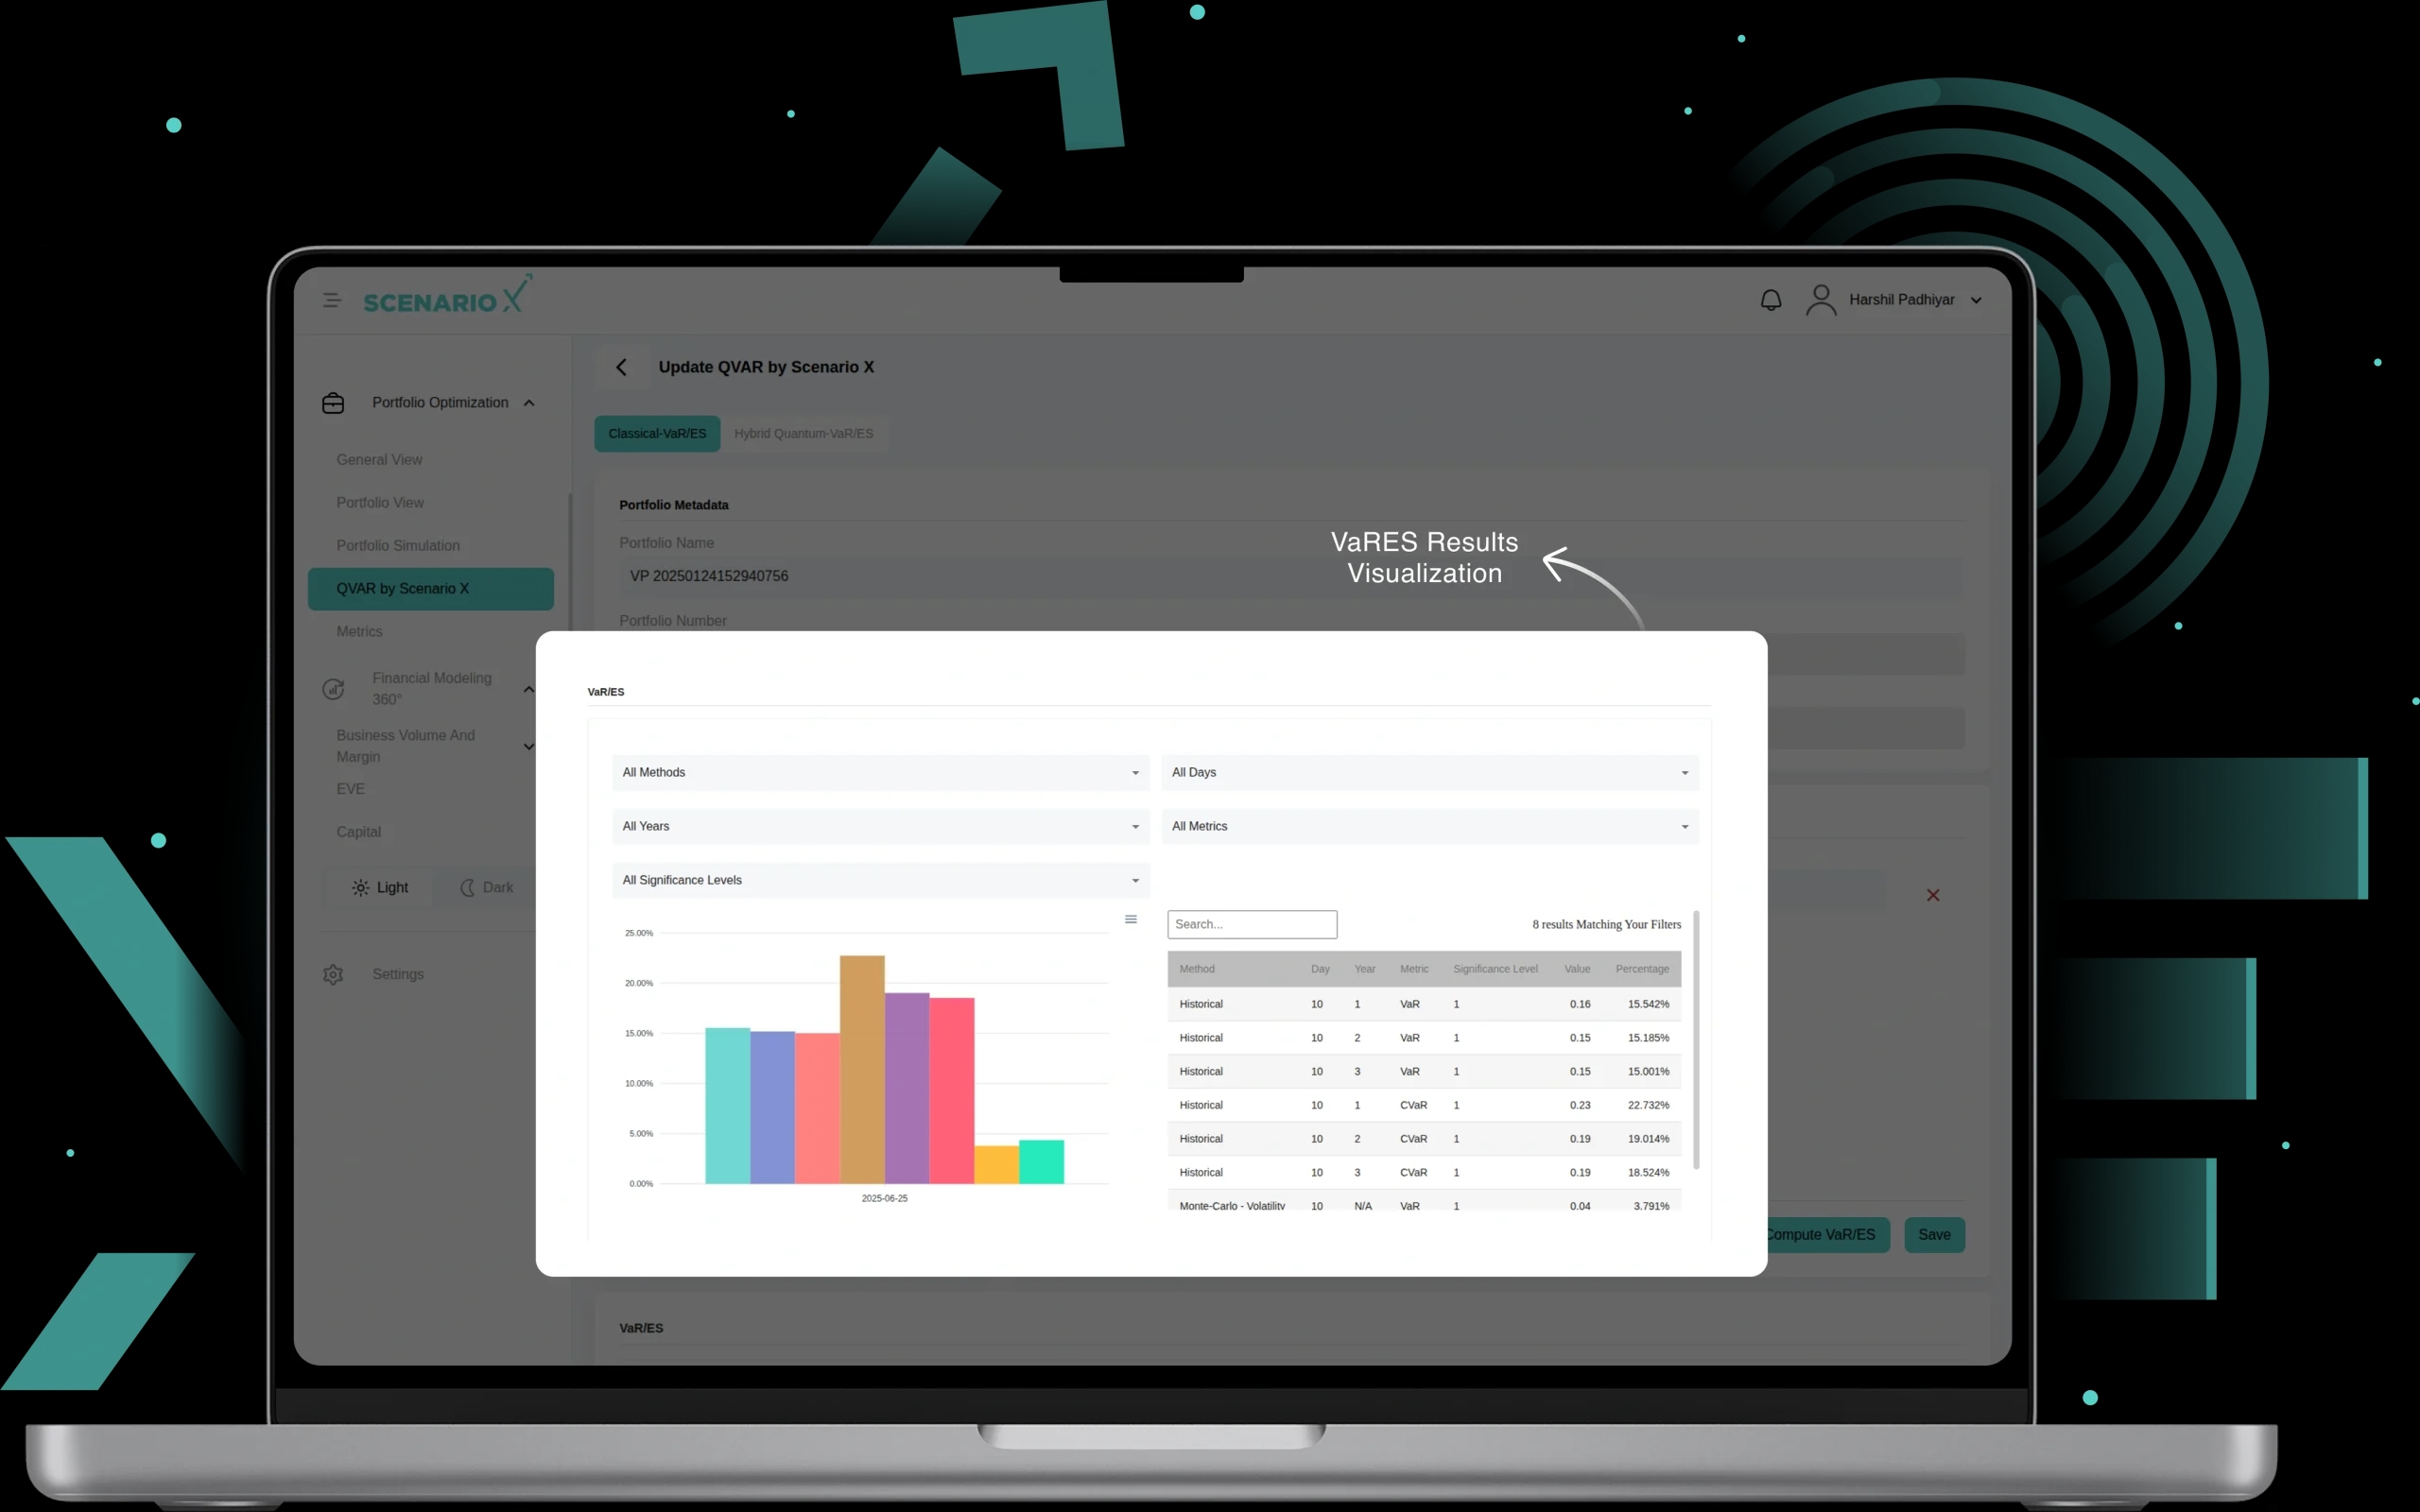
8. QVAR by Scenario-X
This provides advanced Value-at-Risk calculations using both Classical VaRES and Hybrid Quantum-VaRES methodologies for portfolio risk assessment. The module supports portfolio metadata configuration, bulk securities input (JSON format), individual security selection with quantities, flexible VaR parameter settings including method selection, time horizons, significance levels, and comprehensive filtering options, with detailed results visualization showing historical and quantum-enhanced risk metrics.
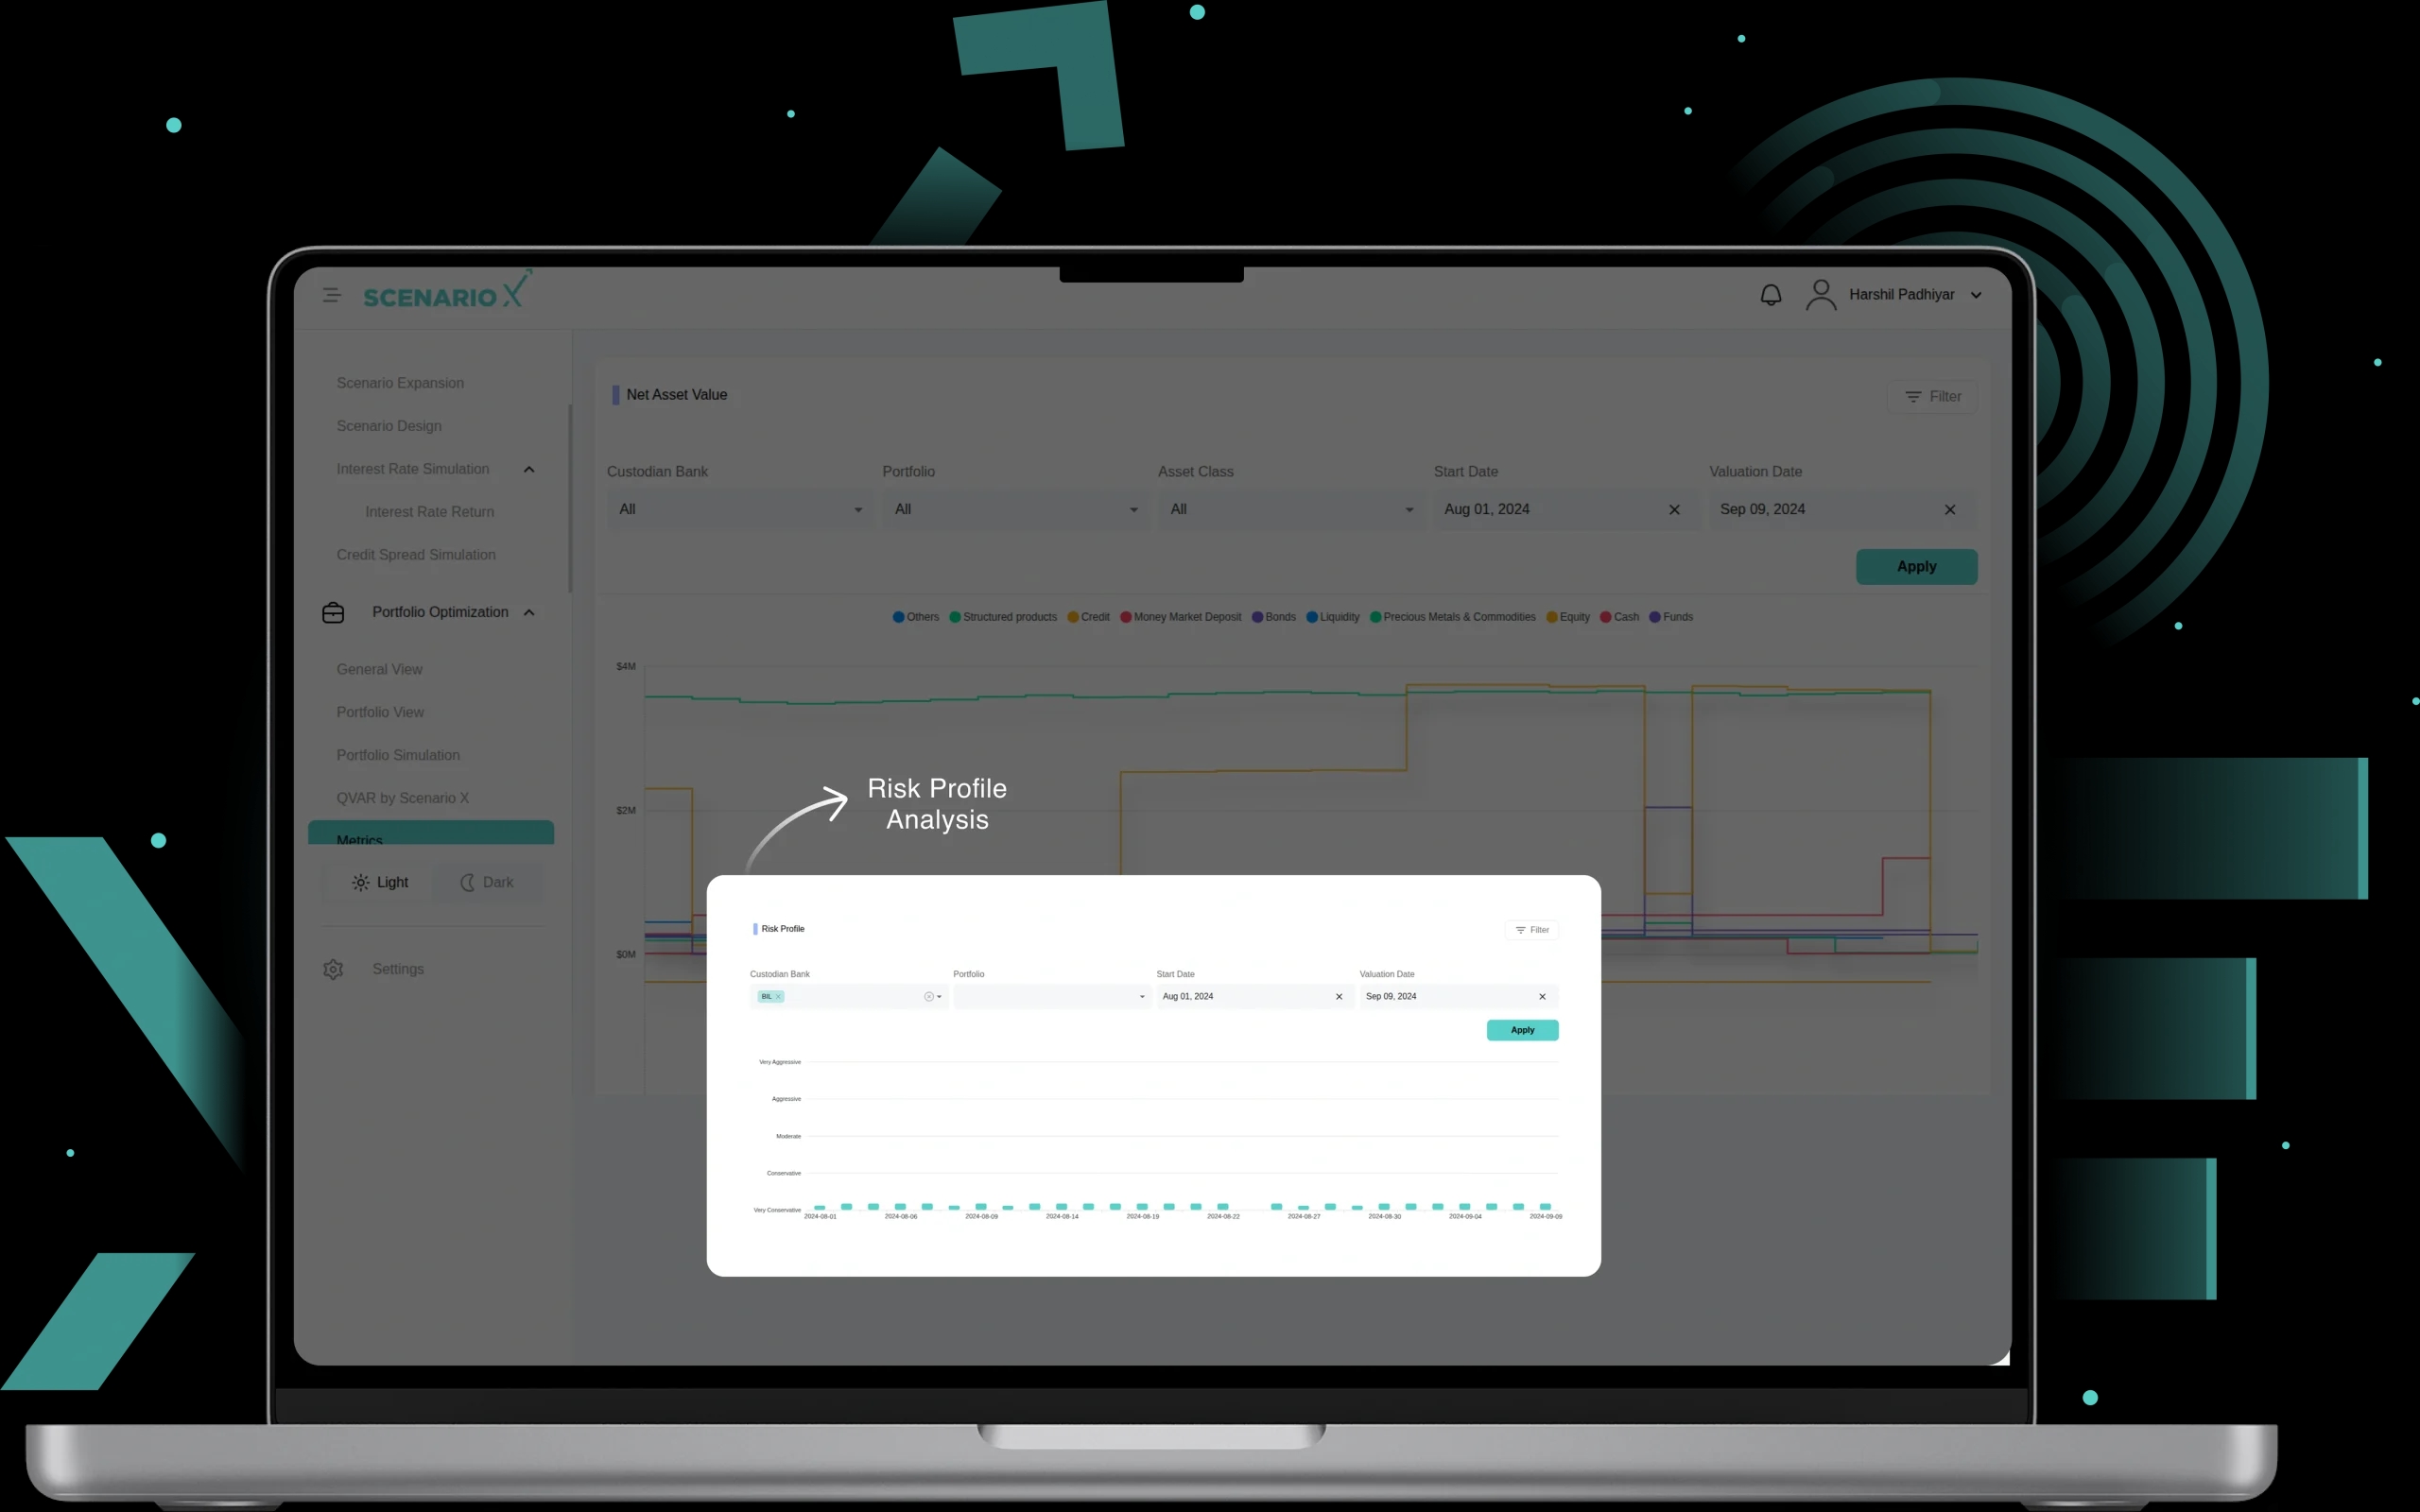
9. Metrics
Comprehensive portfolio analytics including Net Asset Value tracking across multiple asset classes, Risk Profile analysis with custodian bank and portfolio filtering, and VaR/ES calculations with configurable algorithms, significance levels, time horizons, and multiple calculation methods including Historical, Monte Carlo - Volatility, and Monte Carlo - Quantum approaches for advanced risk measurement and performance monitoring.
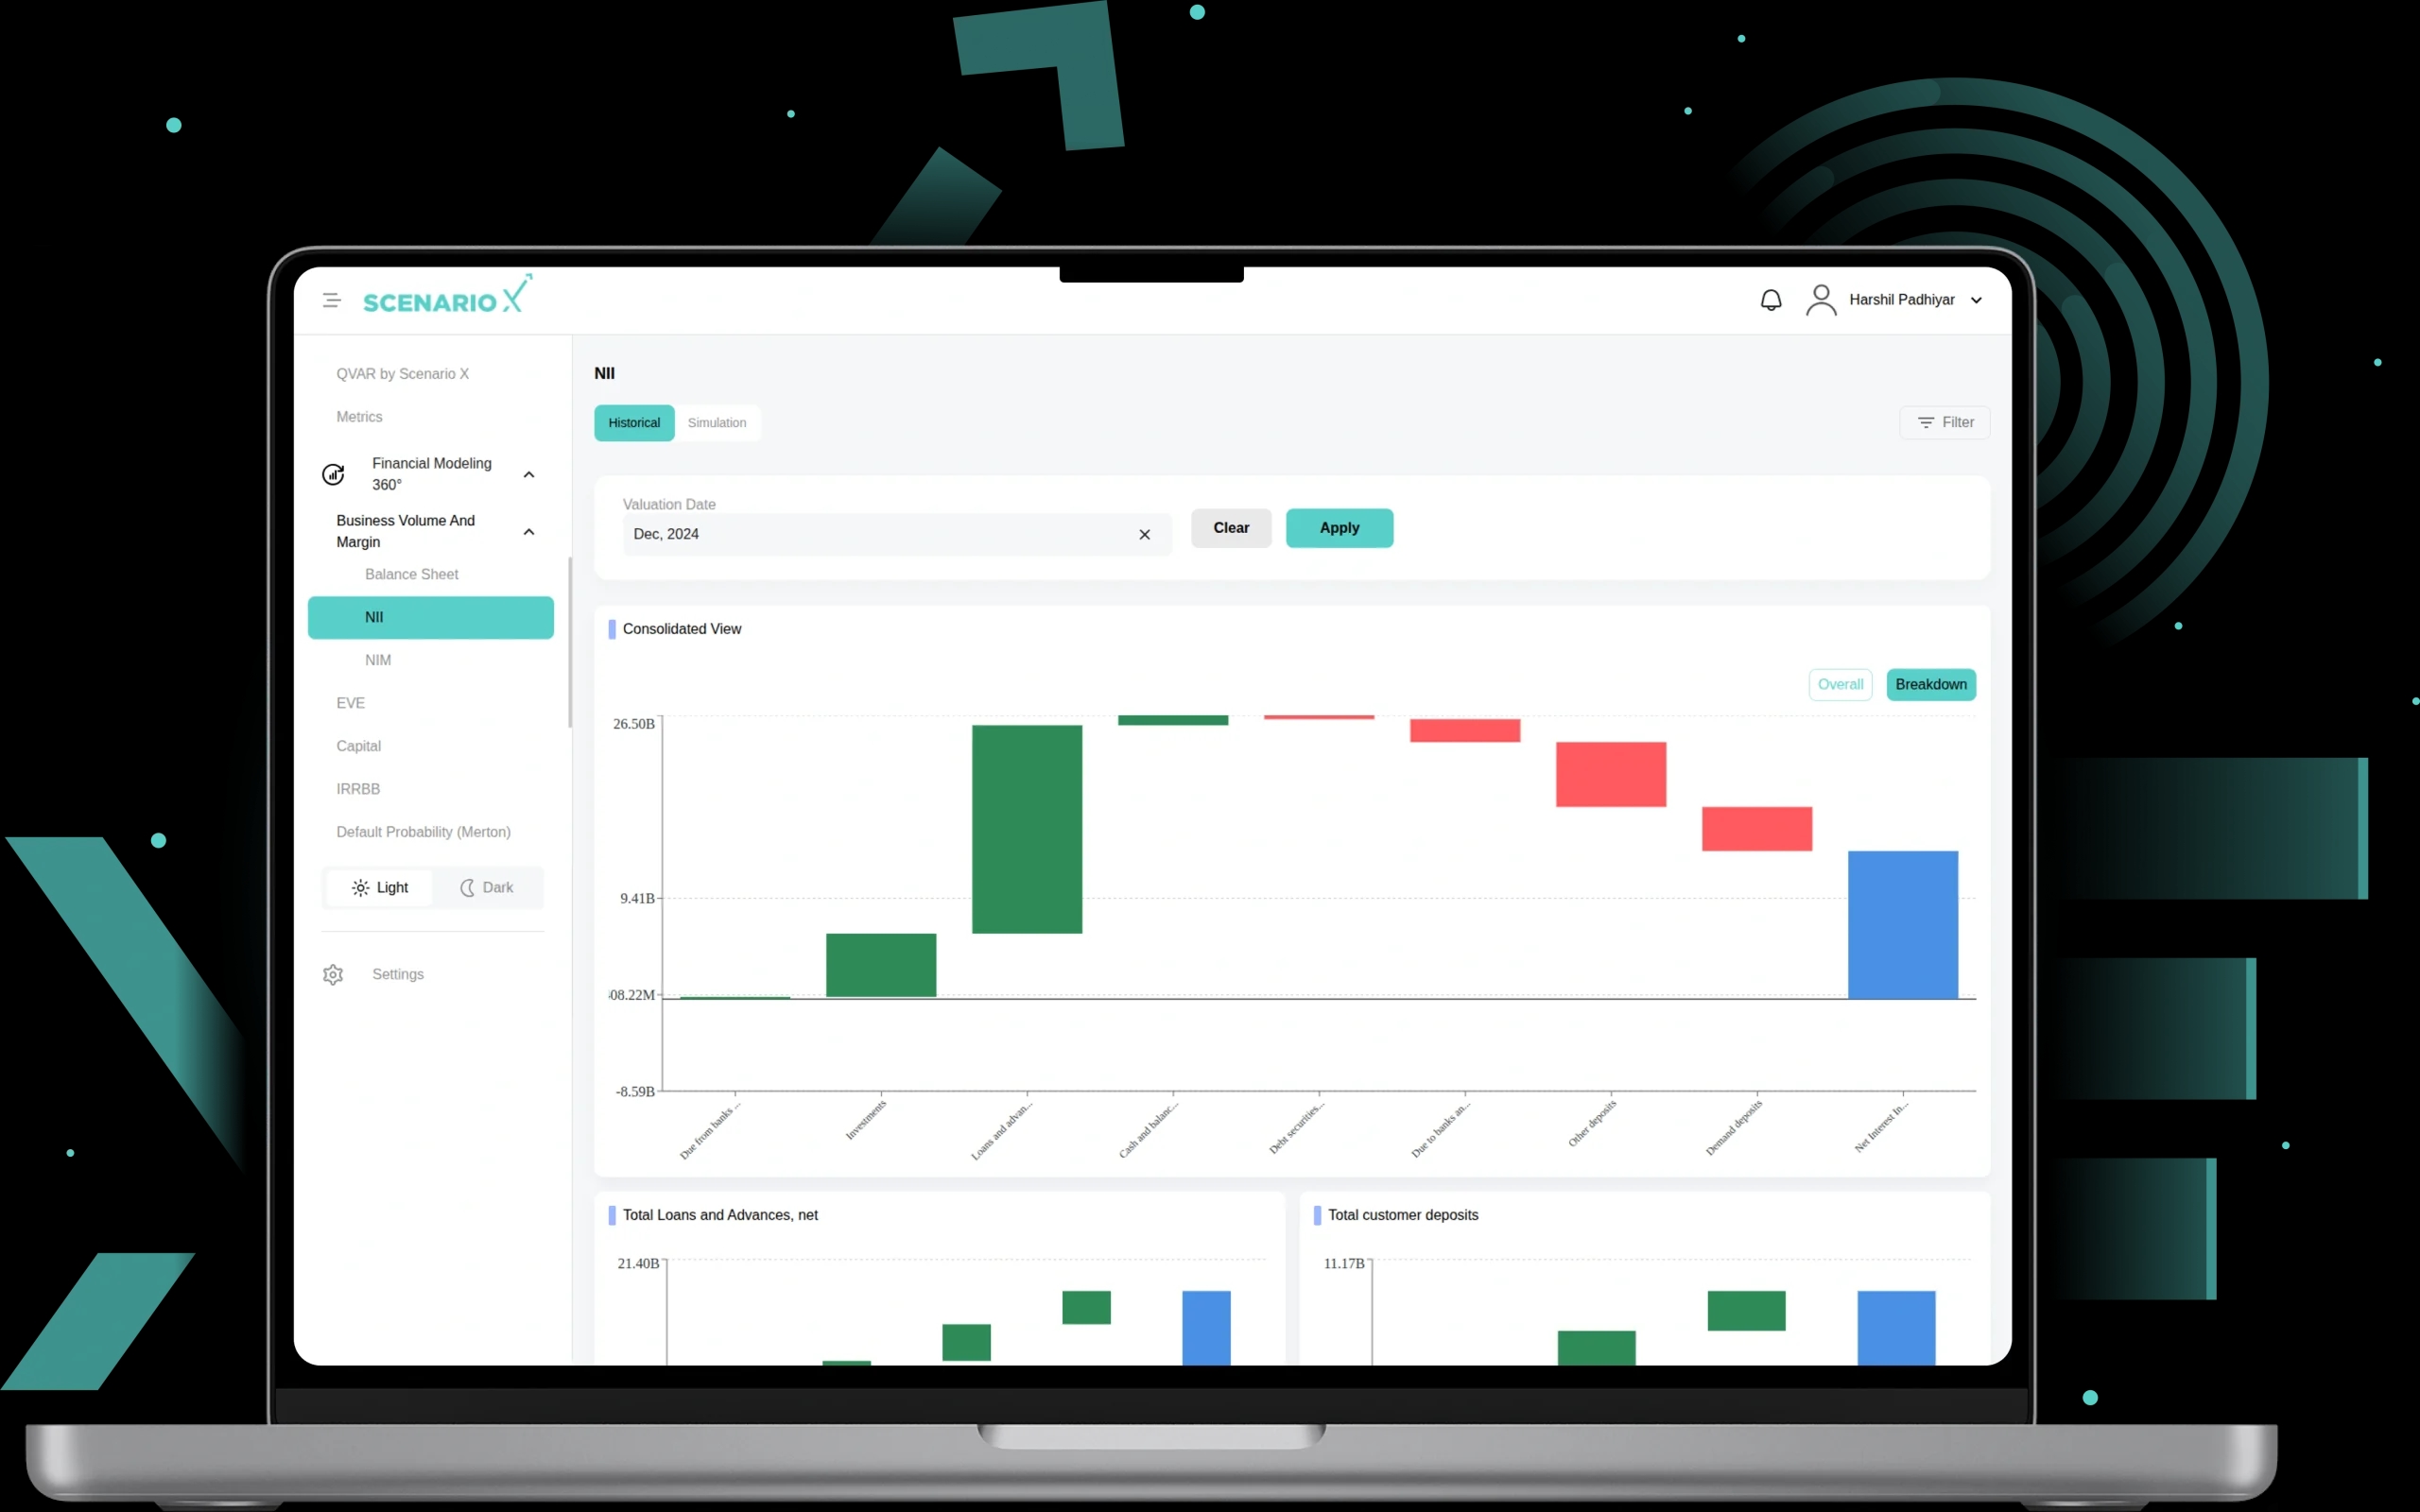
10. NII
This module covers Net Interest Income analysis with Historical and Simulation modes, supporting Waterfall View and Trend View visualizations. The module enables scenario-based NII projection with configurable parameters including scenarios, anchoring points, date range filtering, and detailed breakdown analysis including Consolidated Line View with selectable income components, comparative analysis between Historical and scenario projections, and time-series trend analysis for strategic interest rate risk management and revenue forecasting.
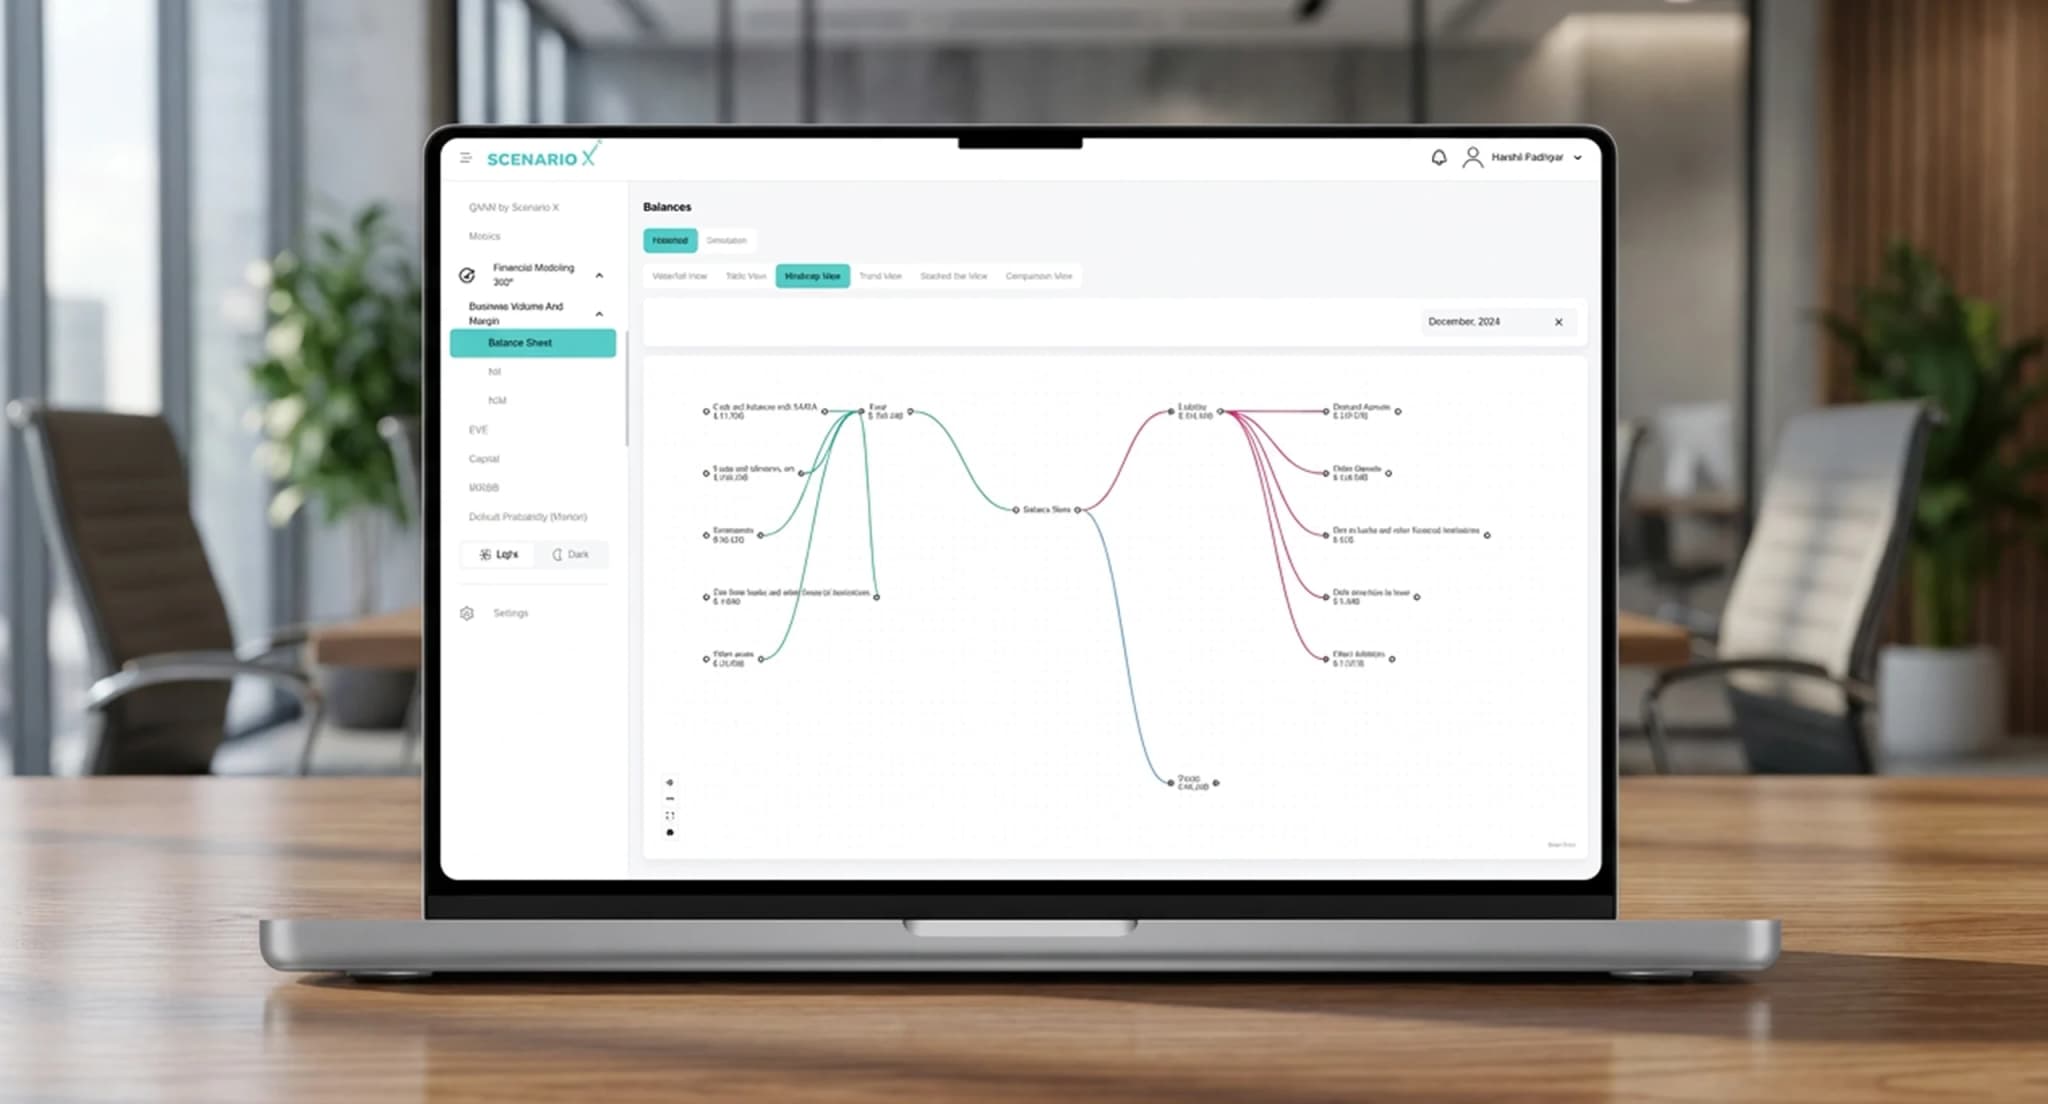
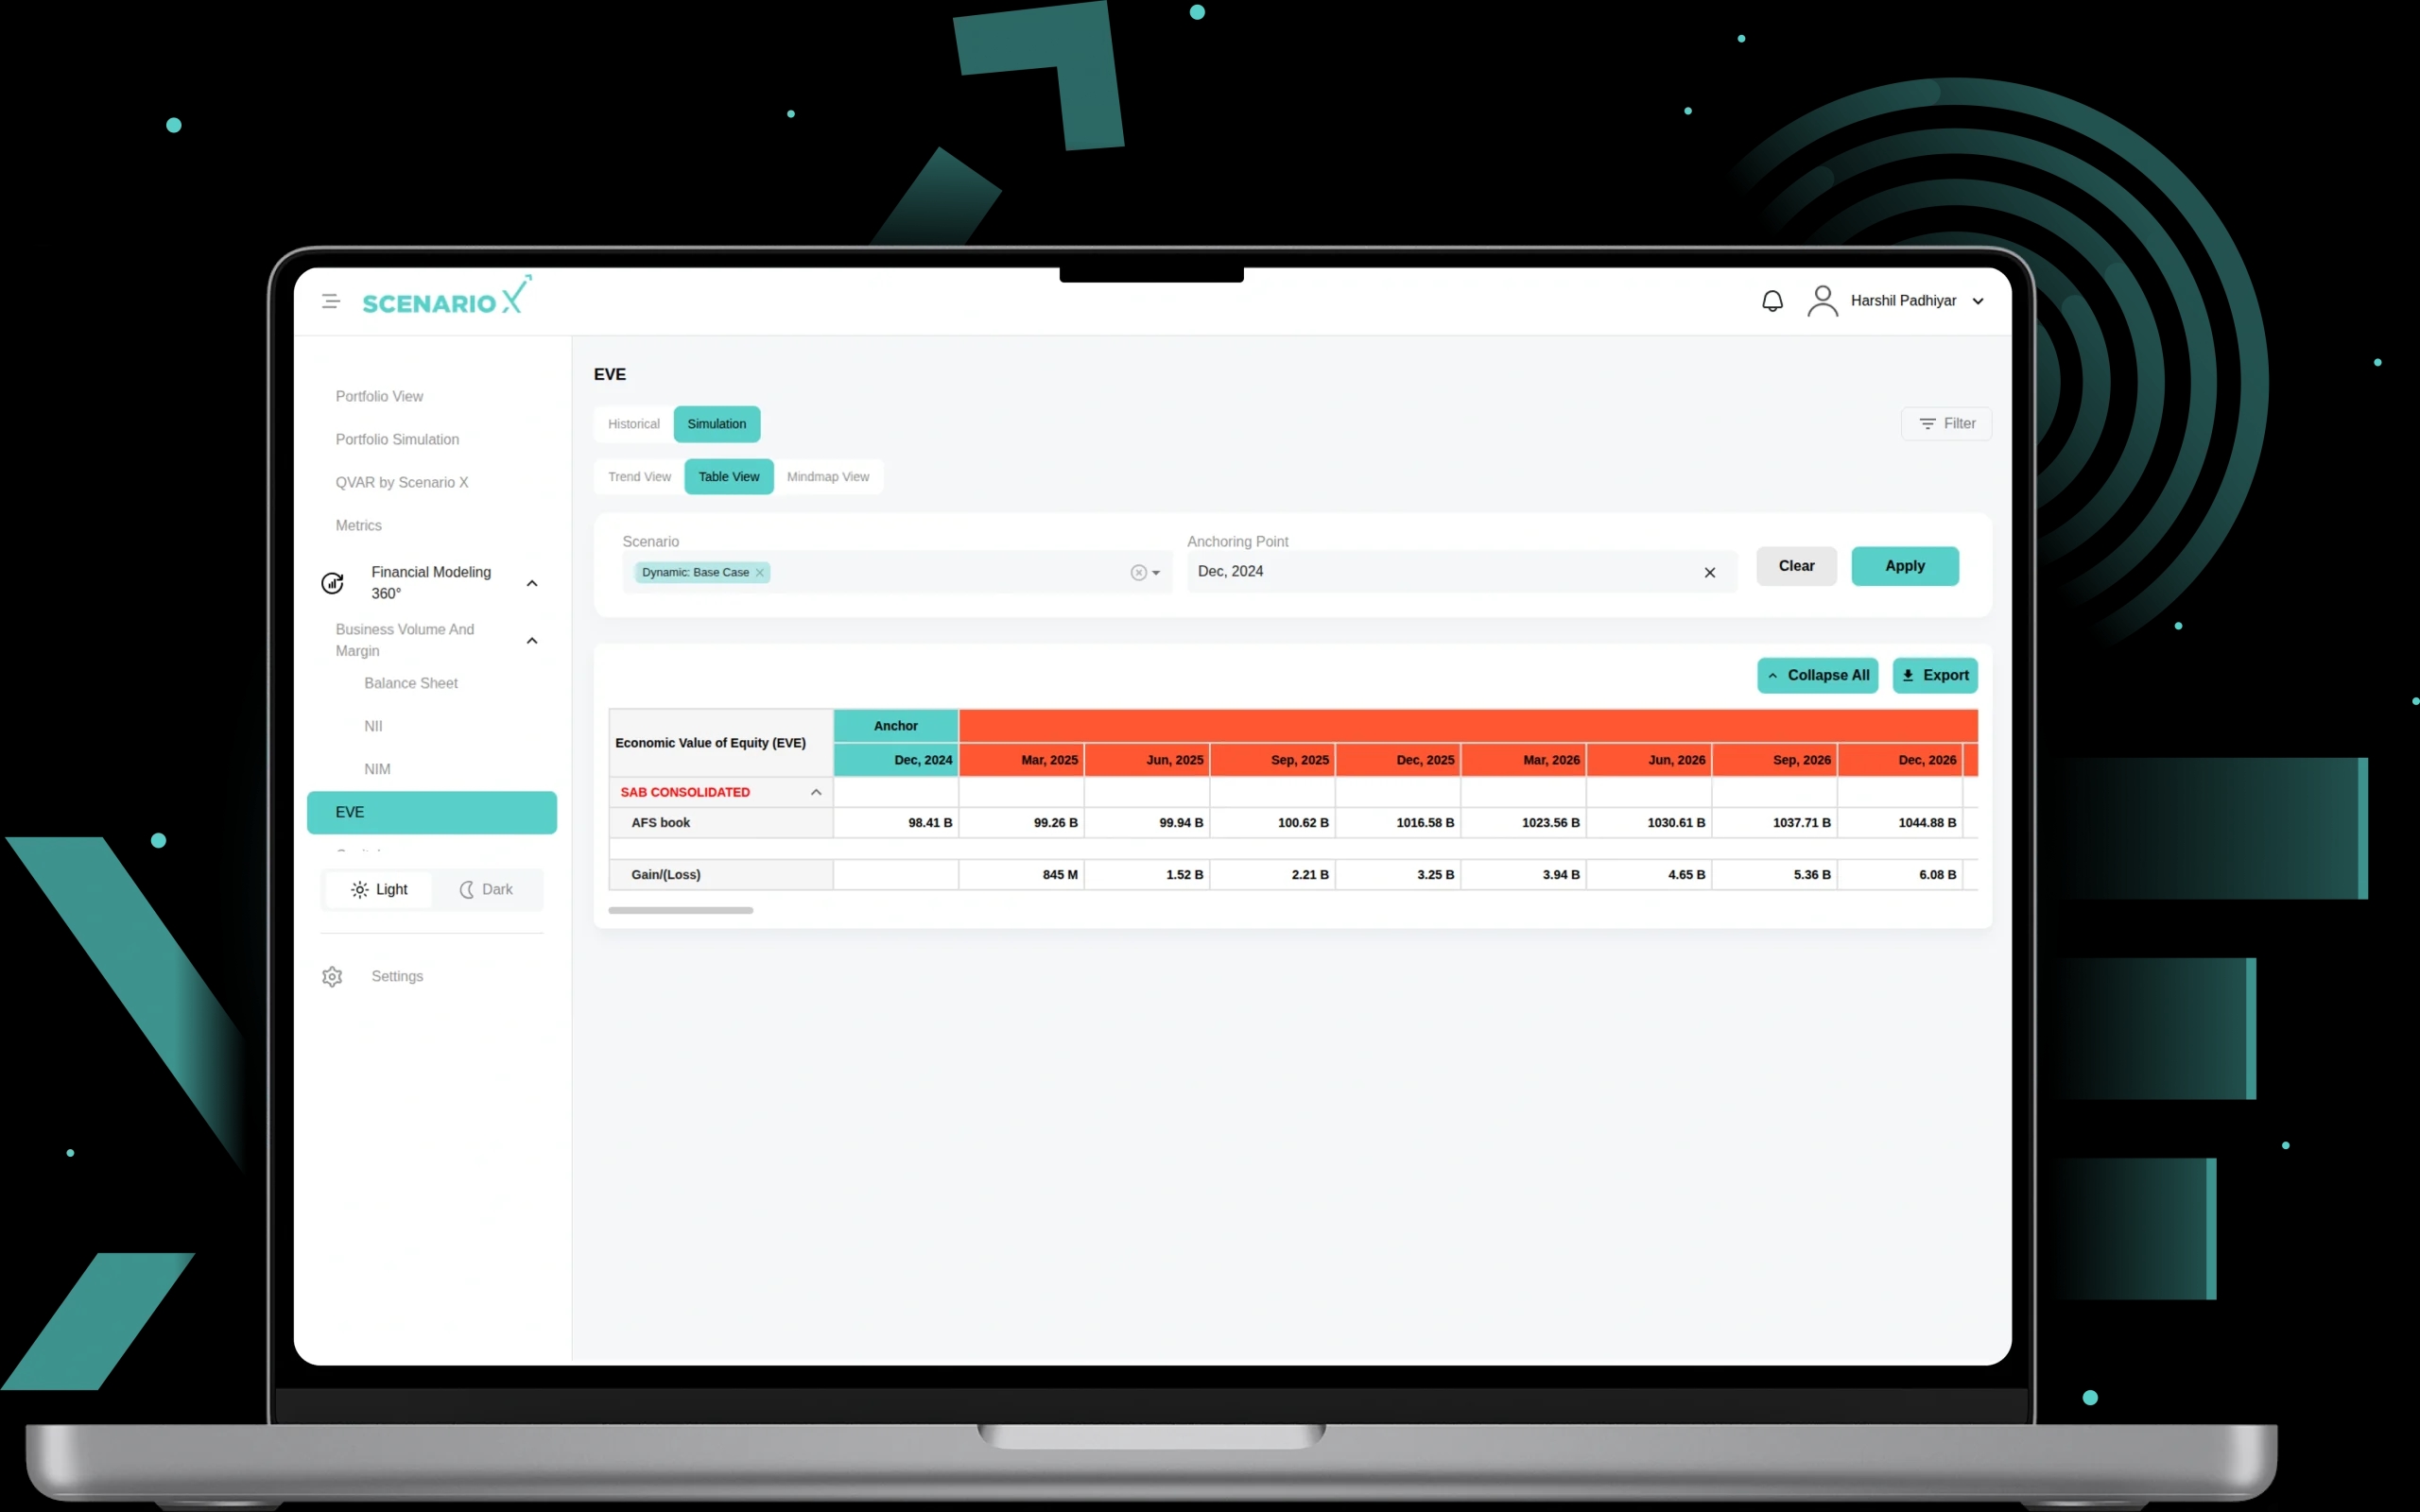
11. EVE
EVE supporting Trend View, Table View, and Mindmap View visualizations. The module enables scenario-based EVE analysis with configurable parameters including various scenarios, anchoring points, and detailed breakdown of AFS book values and Gain/(Loss) calculations. The system provides consolidated view analysis showing EVE impact over time, tabular data with quarterly projections, export capabilities, and interactive mindmap visualization for interest rate sensitivity analysis and regulatory capital adequacy assessment.
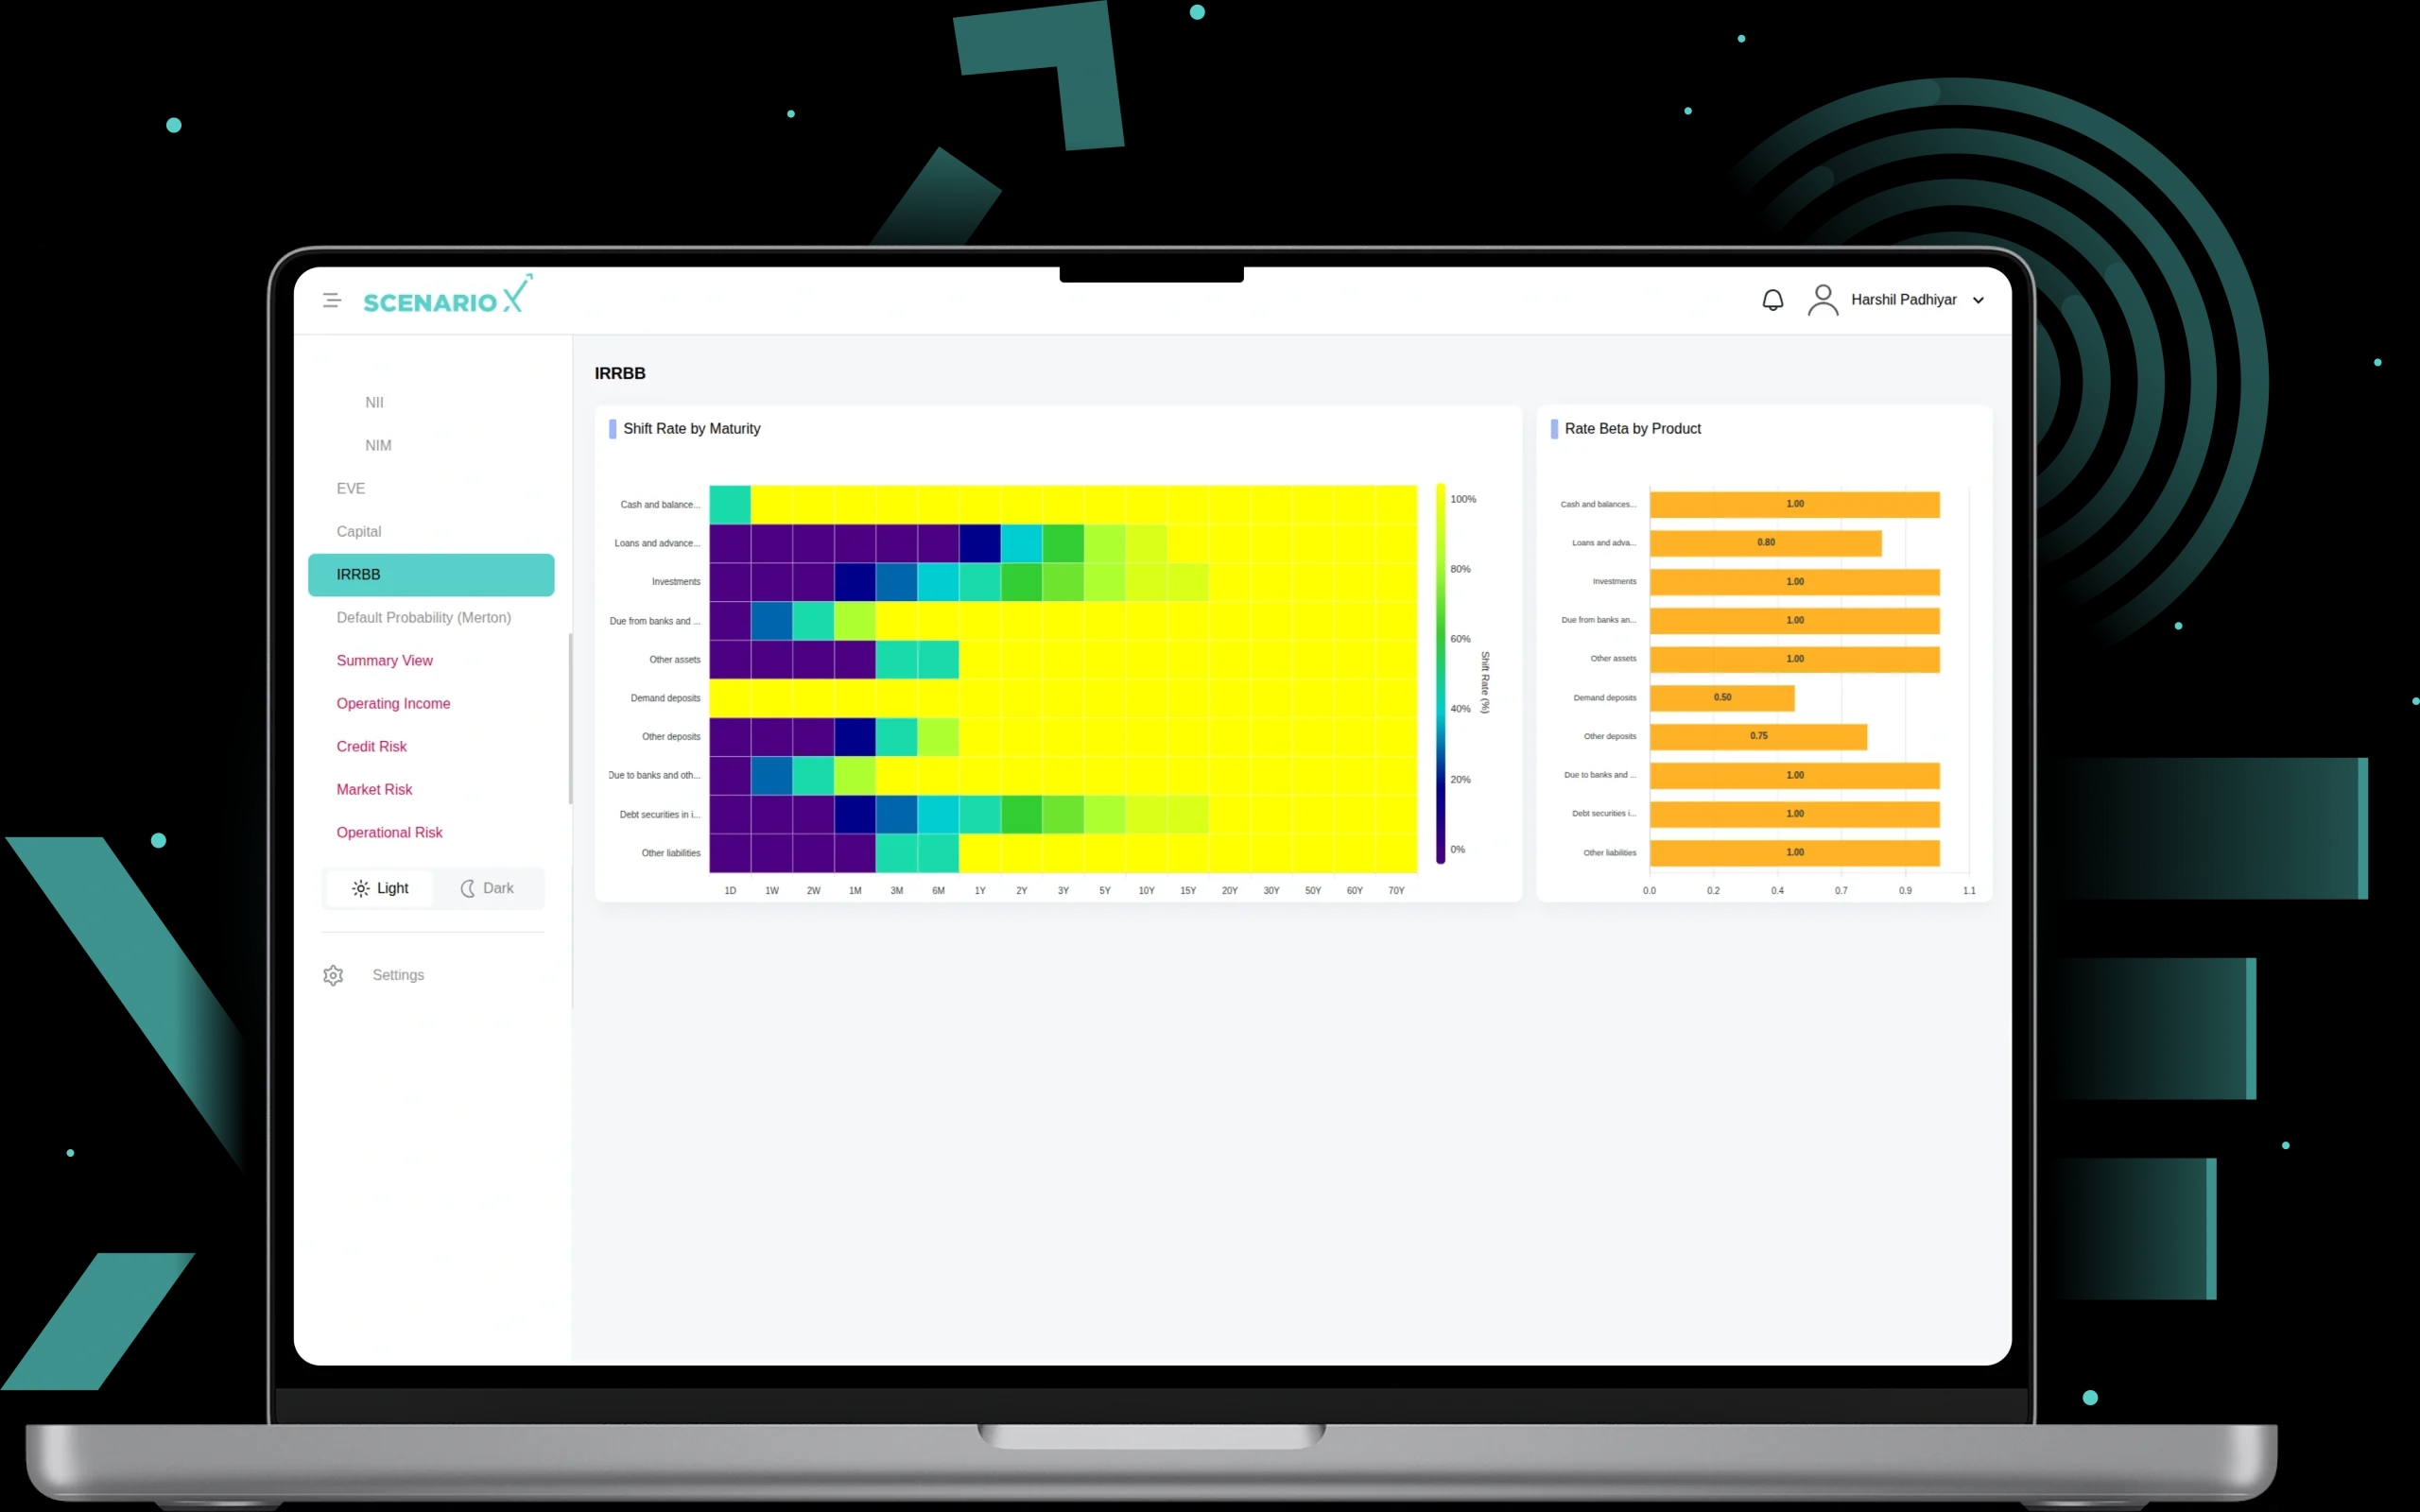
12. IRRBB
Interest Rate Risk in the Banking Book is the view of how interest rate changes impact a bank's assets and liabilities through two core visualizations: a Shift Rate by Maturity heatmap, which highlights the sensitivity of different product categories across various time horizons from 1 day to 70 years using a color-coded scale, and a Rate Beta by Product chart, which shows the pass-through rate sensitivity (beta) of each product to market interest rate movements. Together, these views enable scenario-based analysis of repricing gaps and rate shocks, supporting Basel IRRBB compliance and treasury risk management.
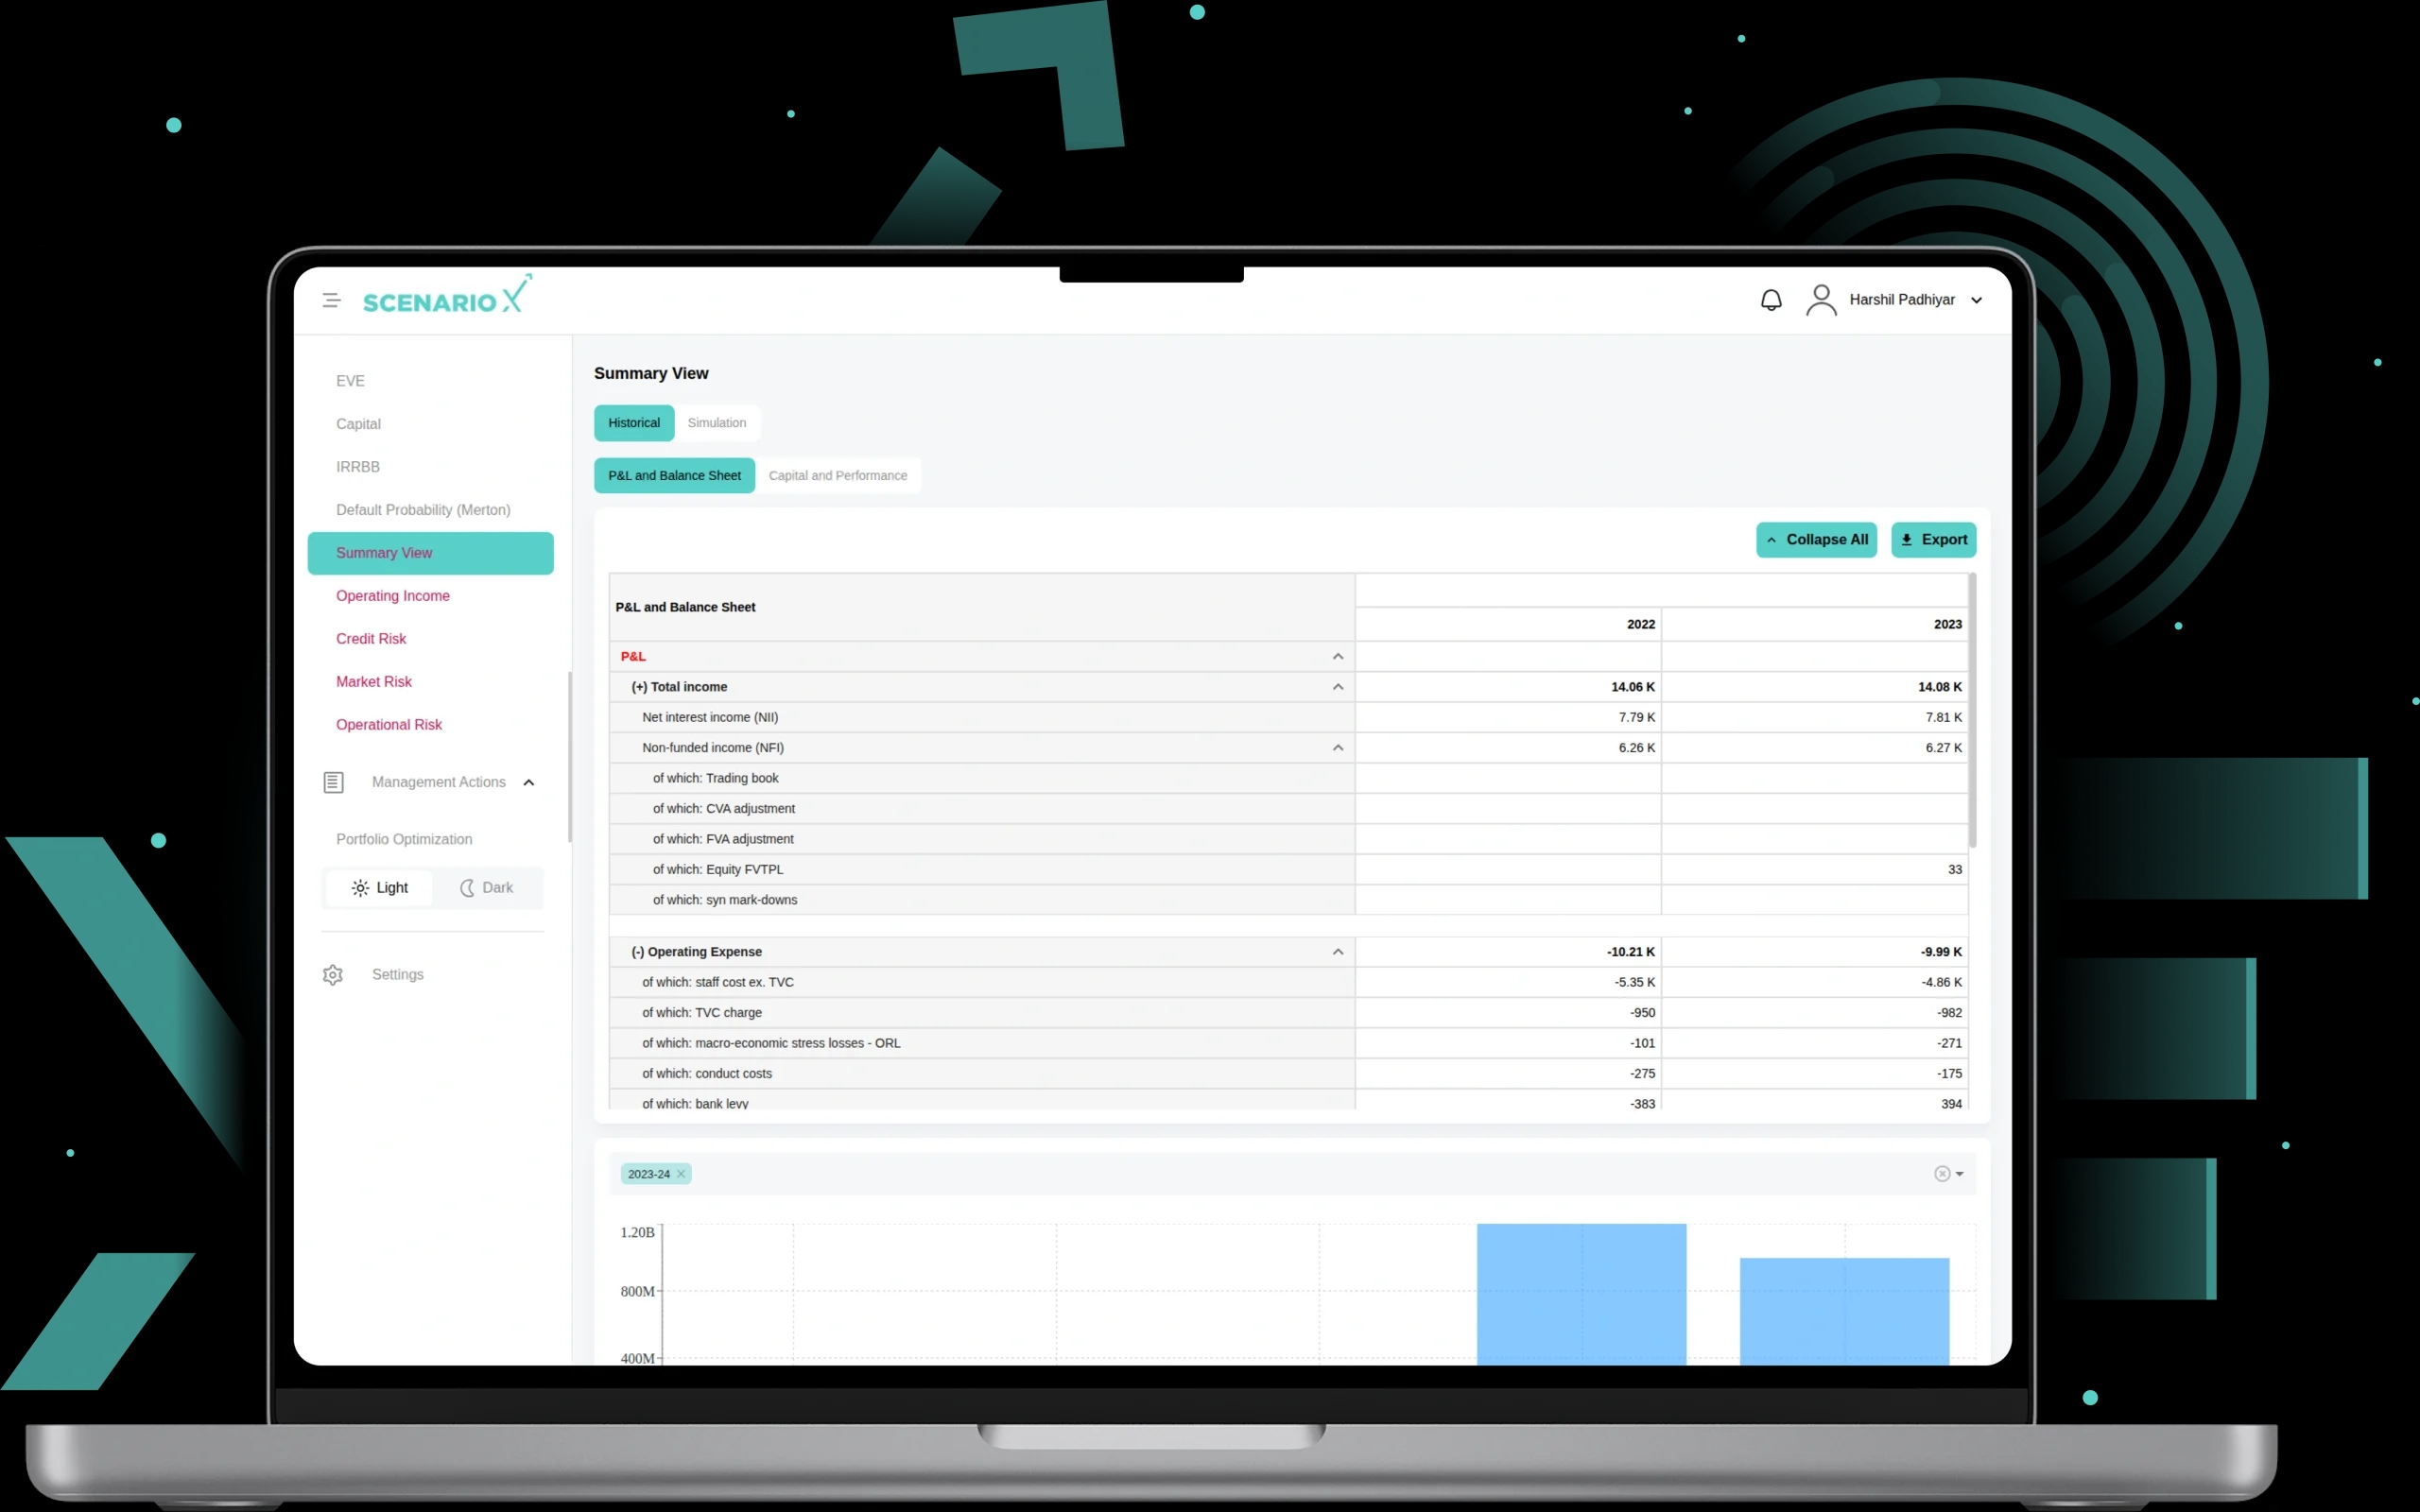
13. Summary View
This module offering Historical and Simulation modes with P&L and Balance Sheet and Capital and Performance perspectives. It provides scenario-based projections anchored to configurable reference points, displaying structured tabular data alongside waterfall visualizations. Key components include Total Income, Net Interest Income (NII), Non-Funded Income (NFI), Operating Expenses, Capital metrics (CET1, Total Equity, OCI adjustments, dividends, deductions), and Profit/Loss outcomes. The view enables comprehensive evaluation of income, expenses, and capital performance under different scenarios.
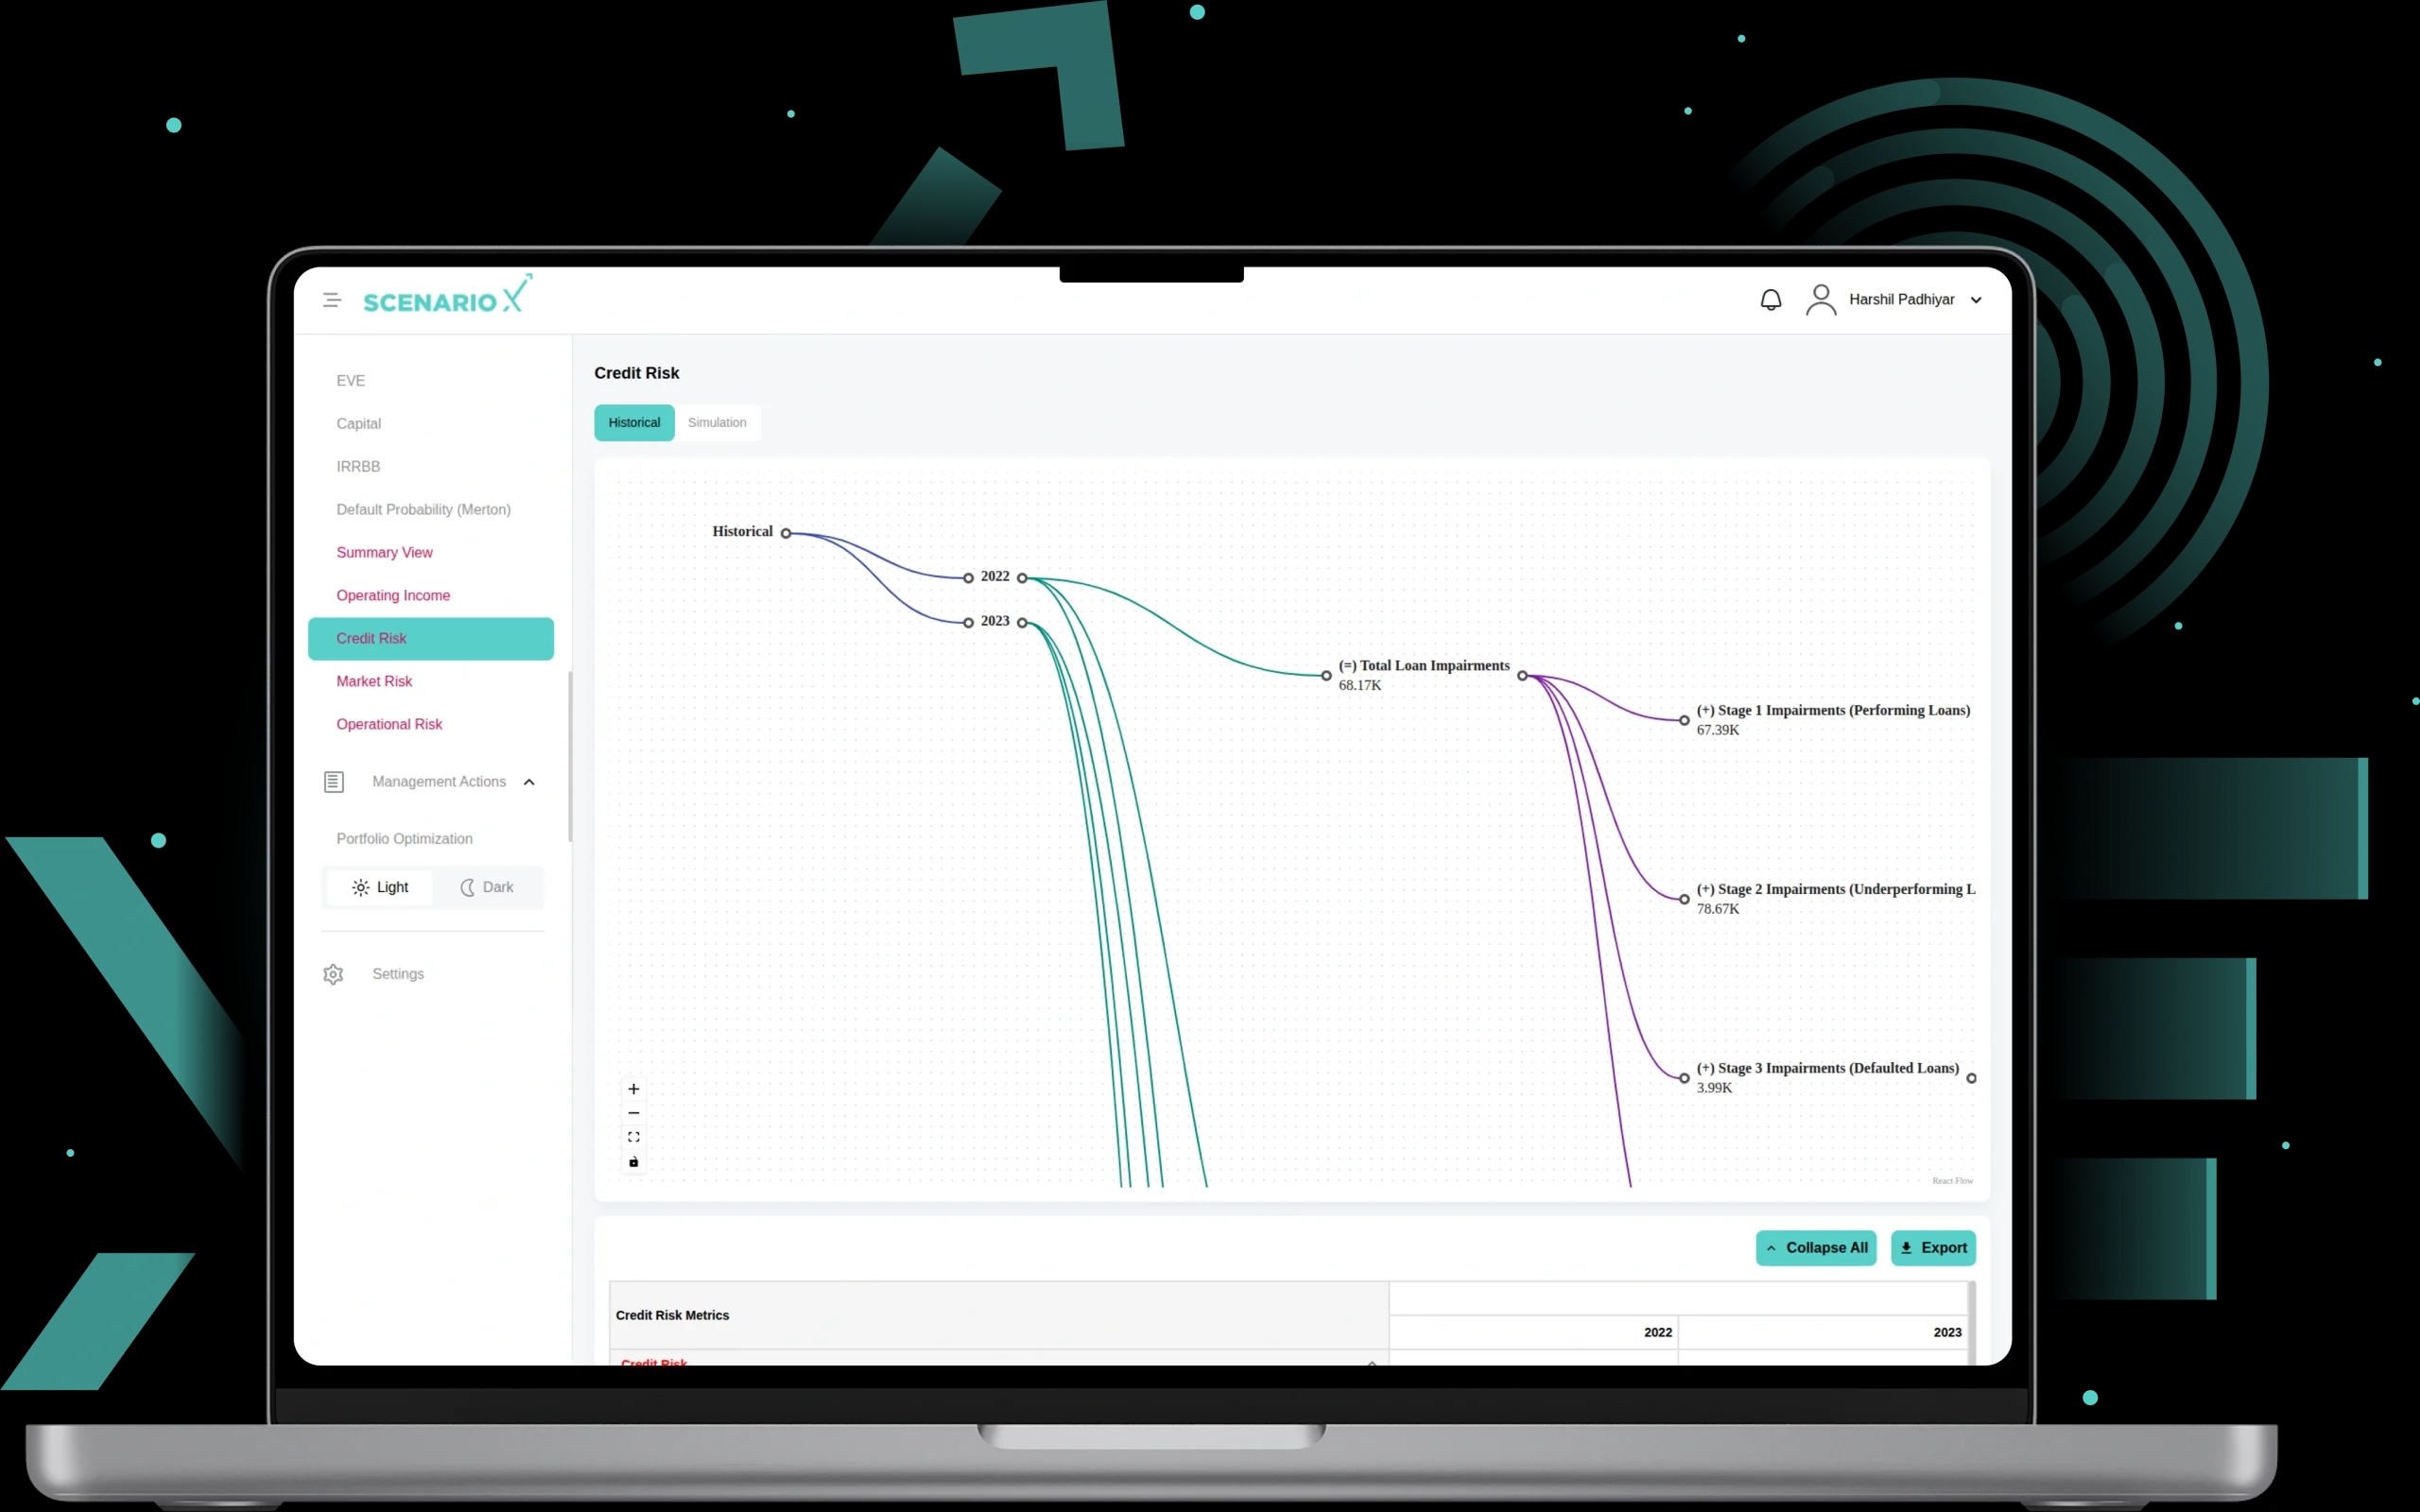
14. Credit Risk
A risk management module with Historical and Simulation modes that measures and projects loan impairments across multiple scenarios. It provides a flow visualization linking time periods to Total Loan Impairments, broken down into Stage 1 (Performing Loans), Stage 2 (Underperforming Loans), and Stage 3 (Defaulted Loans) categories. The tabular view details impairments by business segment including Retail, SME, Corporate, and Sovereign, enabling granular analysis of credit quality deterioration.
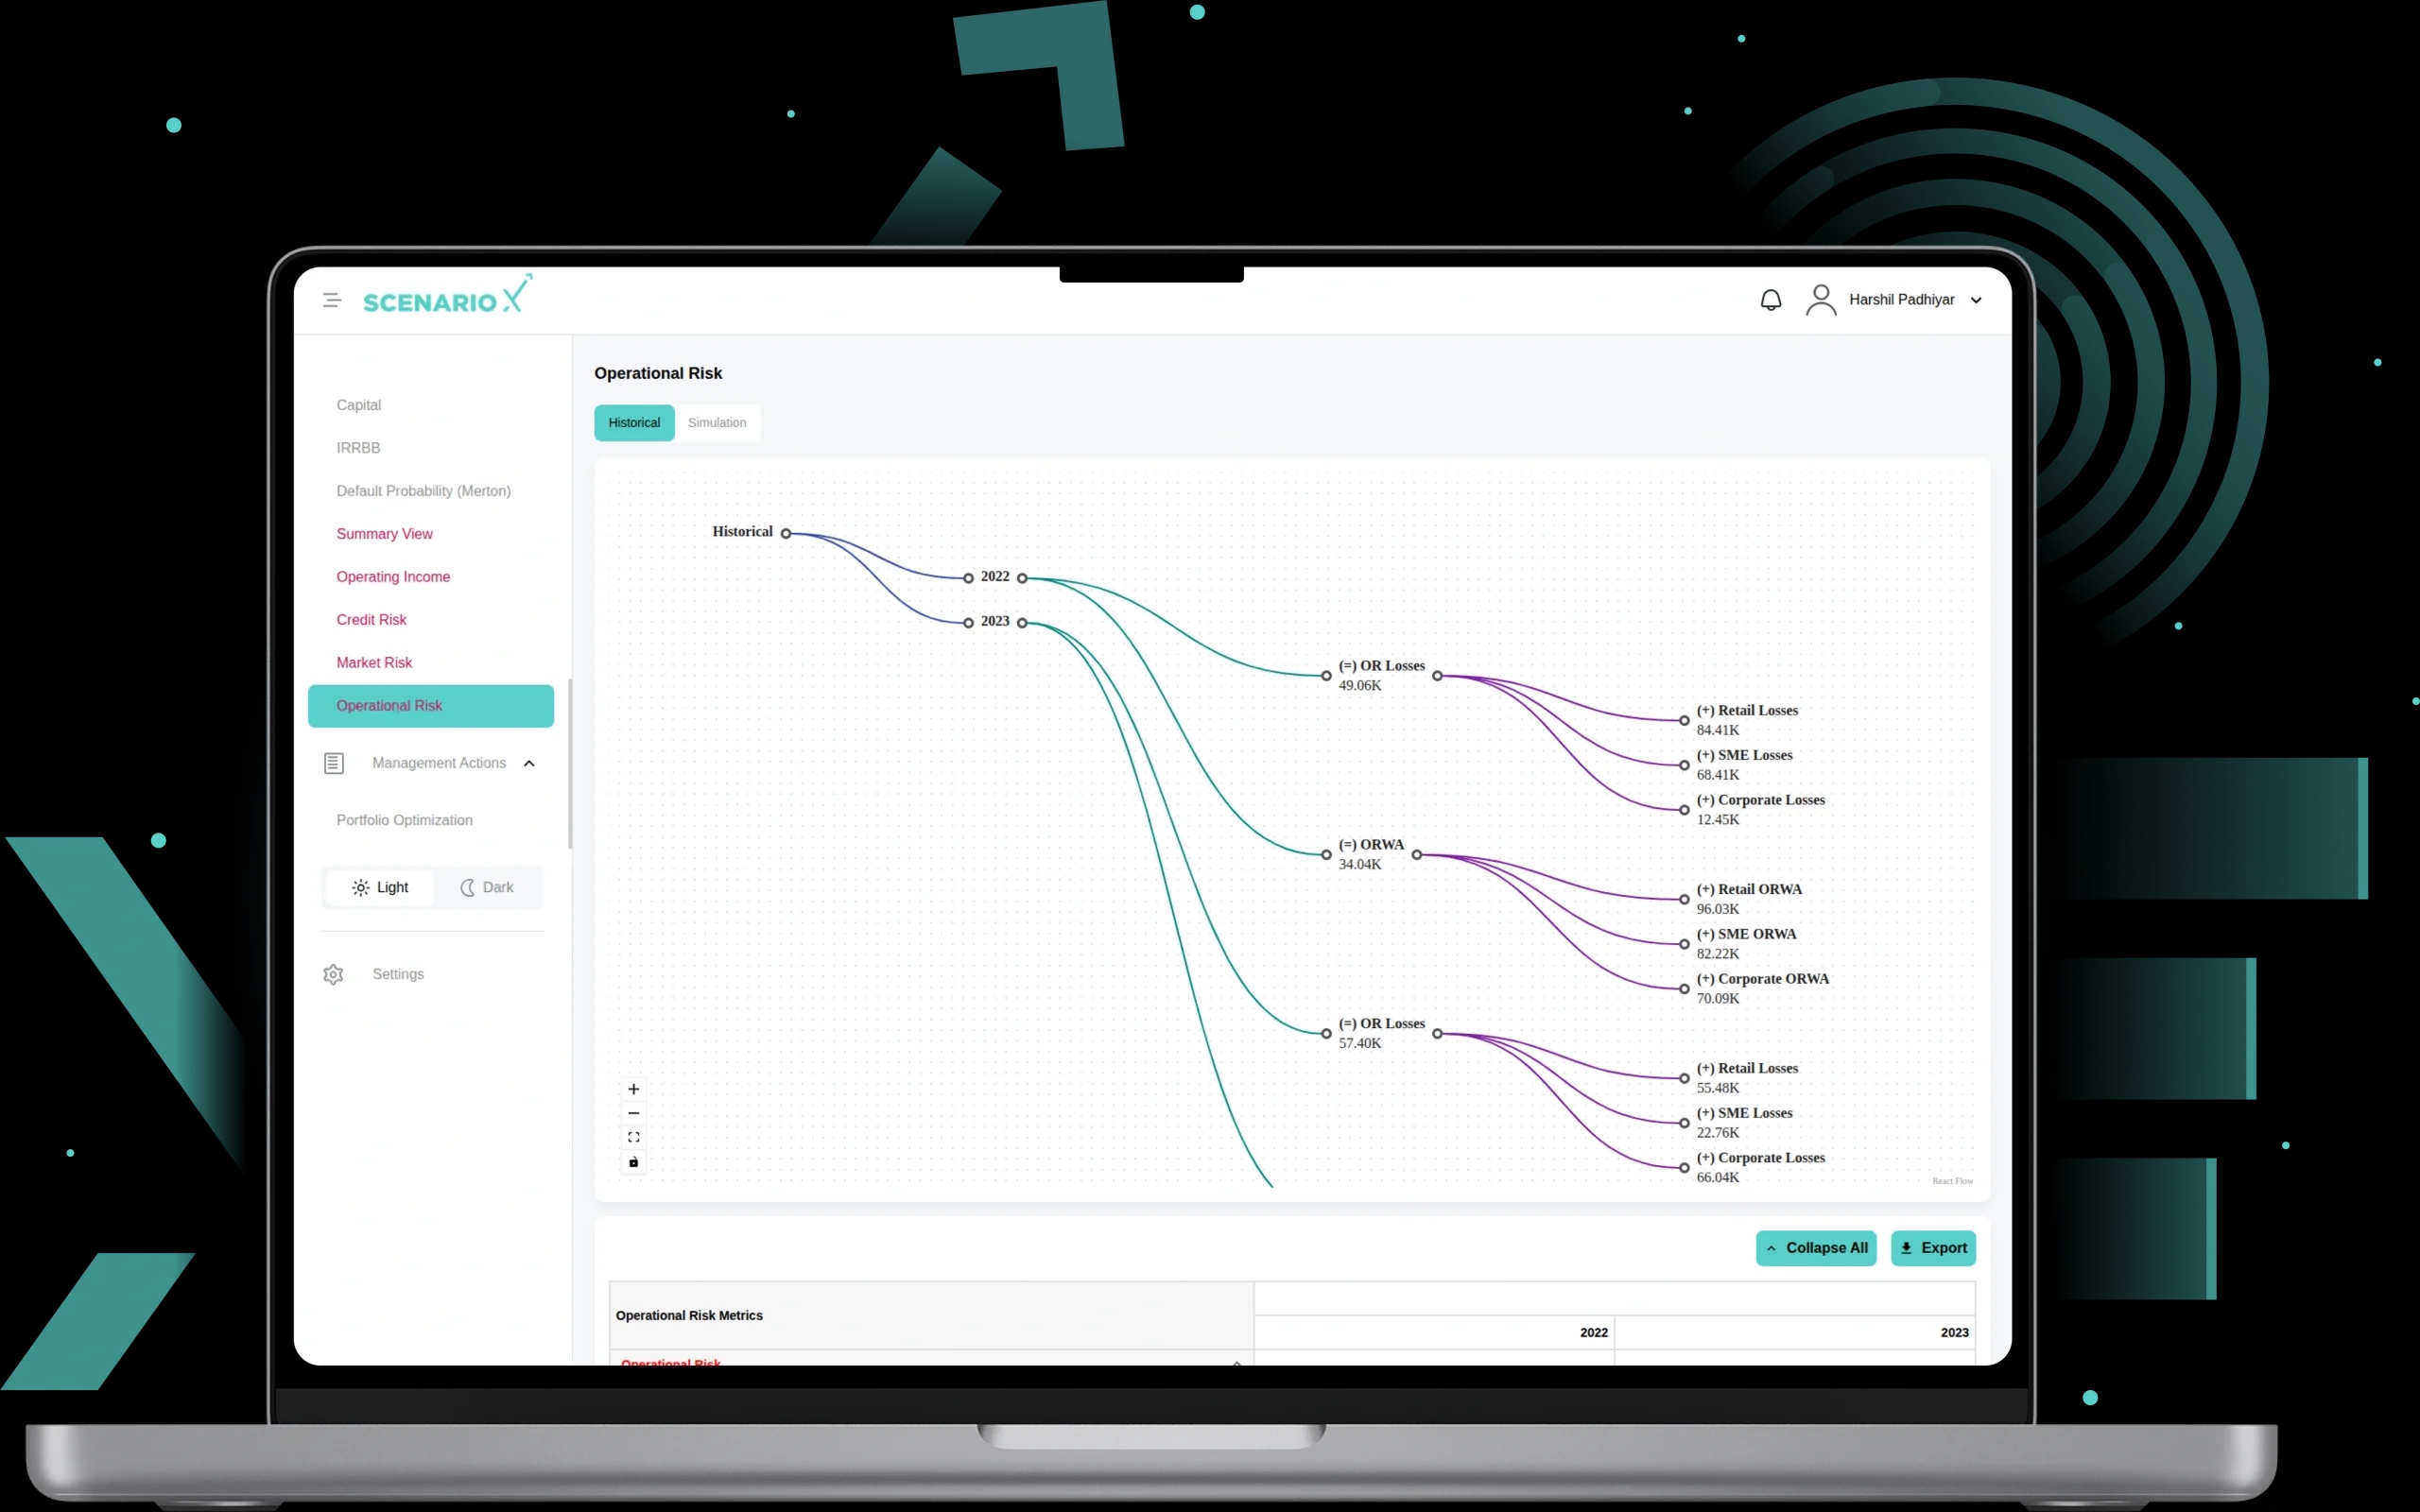
15. Operating Risk
A measurement module that provides Historical and Simulation modes to assess exposure from non-financial risk events. It tracks Operational Risk (OR) Losses and Operational Risk-Weighted Assets (ORWA) with breakdowns by Retail, SME, and Corporate segments. The flow visualization links periods and scenarios to total losses and risk-weighted exposures, while the tabular view details segment-level impacts. This module supports stress testing, scenario analysis, and regulatory capital planning.
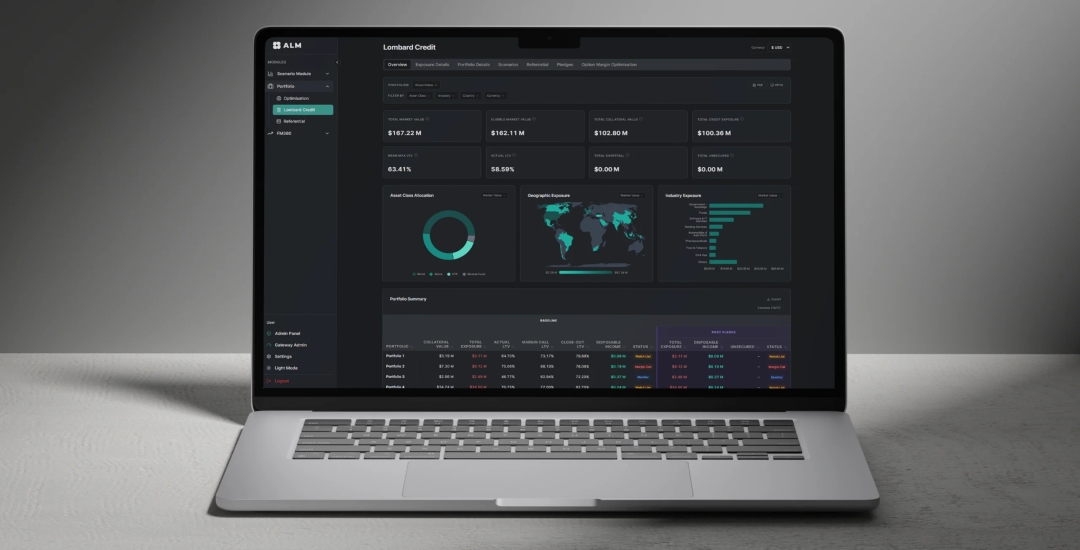
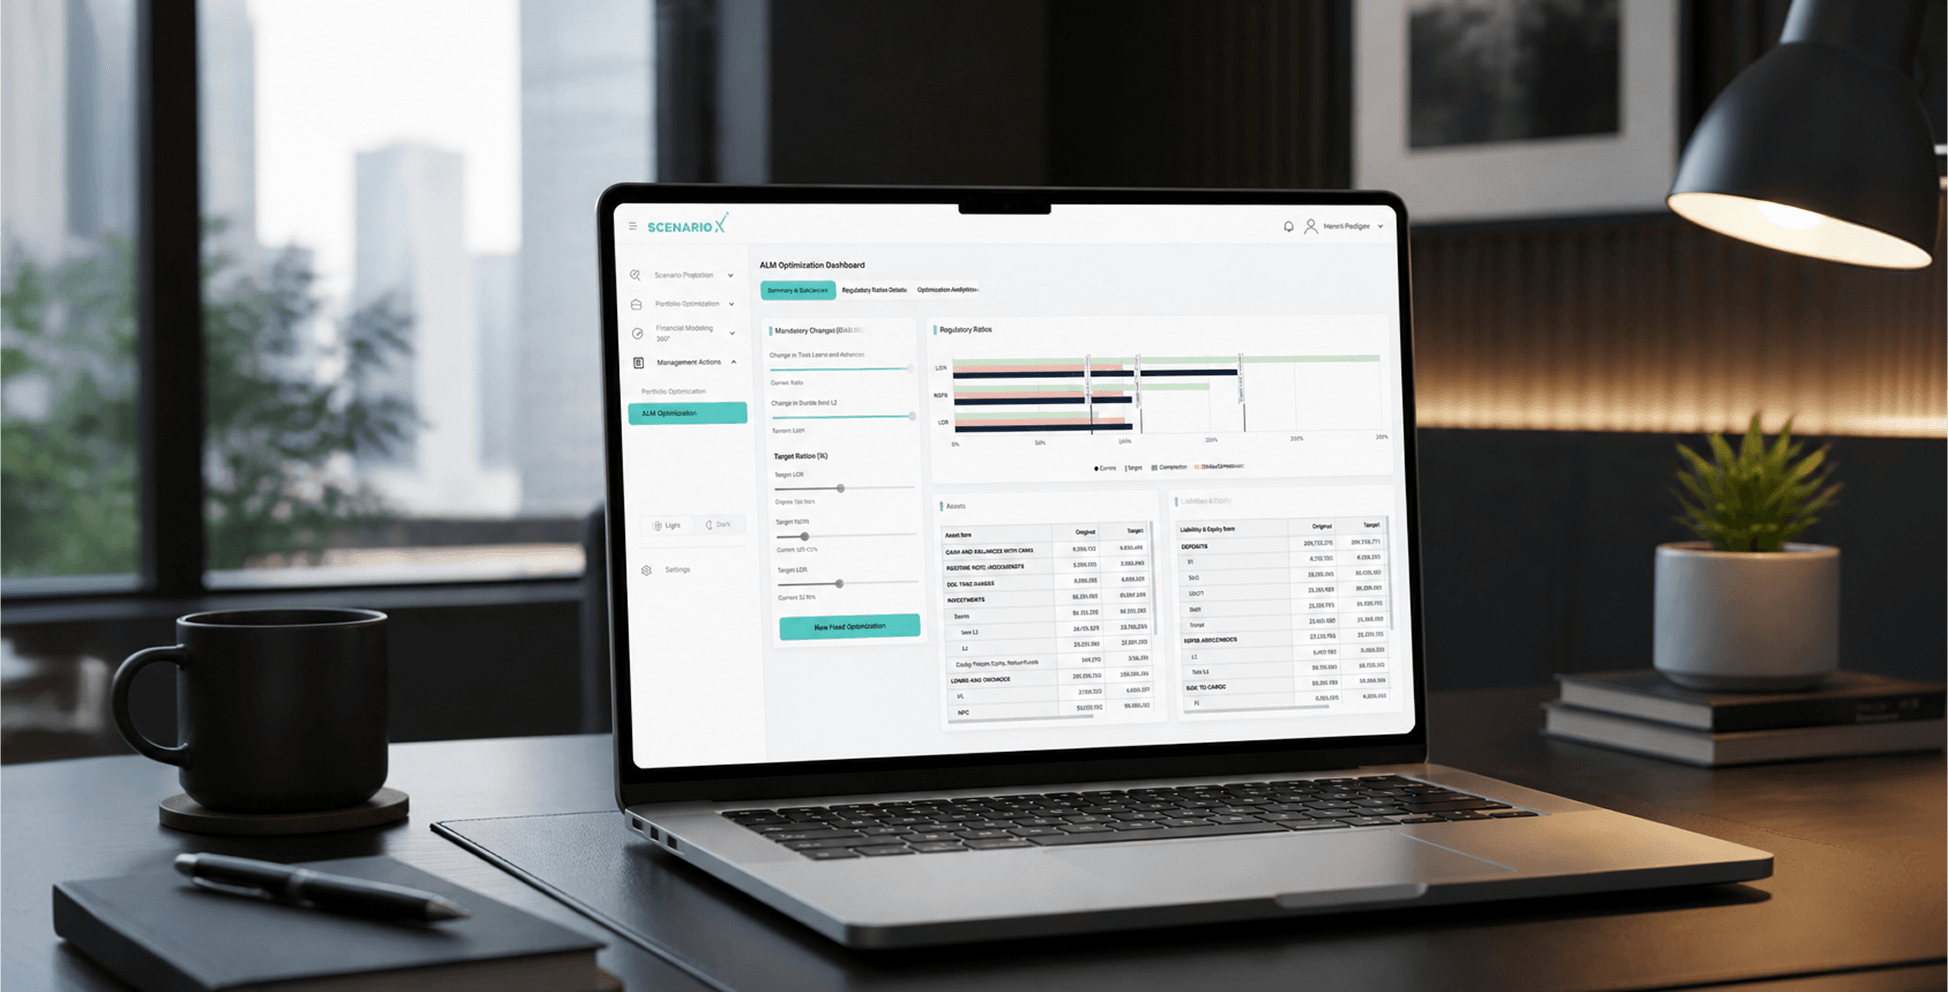
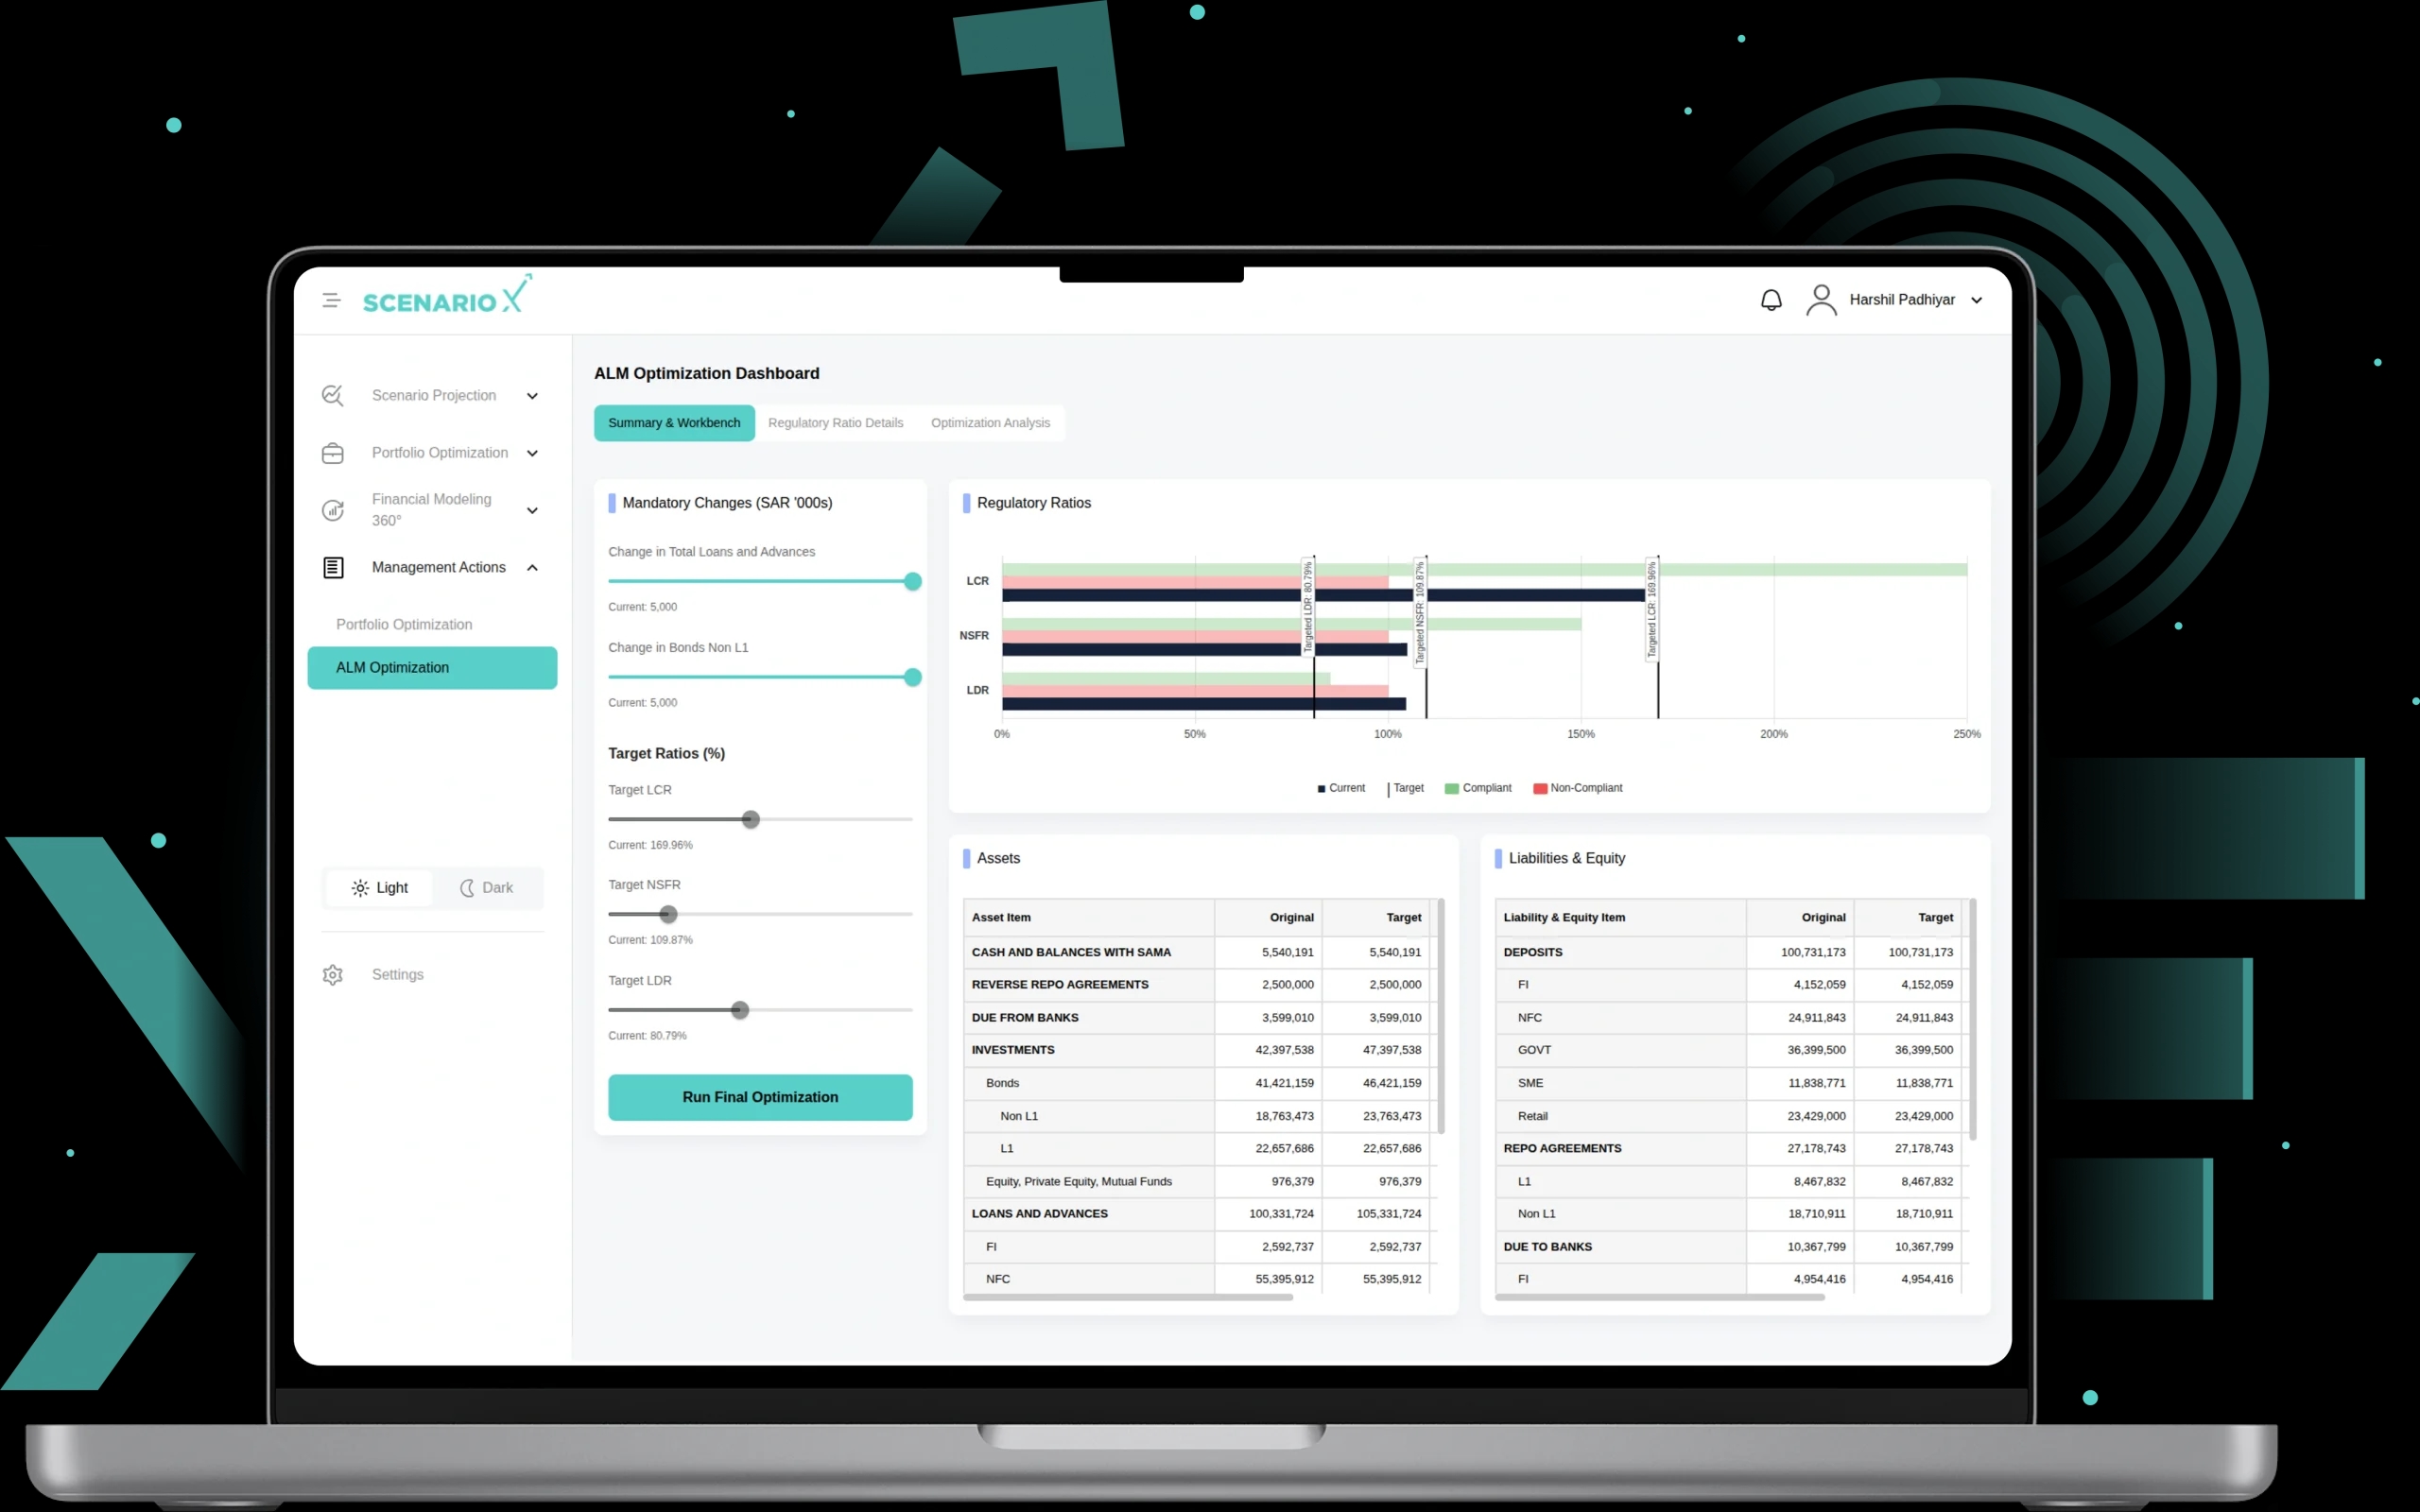
16. ALM Optimization
A dashboard for analyzing and improving balance sheet efficiency under regulatory and internal constraints. It includes Summary & Workbench for adjusting assets, liabilities, and target ratios (LCR, NSFR, LDR), Regulatory Ratio Details for compliance monitoring with detailed breakdowns of inflows, outflows, and funding structures, and Optimization Analysis that compares original, target, and optimized results. The system highlights optimized balance sheet changes across assets and liabilities, showing improvements in funding ratios, liquidity, and capital allocation.
Technologies Used
Scenario-X is built with modern frontend technologies and specialized charting libraries for data-intensive financial visualizations.
Frontend Technology
NextJs
Third-Party Packages
Recharts
Third-Party Packages
ApexCharts
Third-Party Packages
MSAL
Conclusion
Scenario-X demonstrates how AI-Quantum technology can transform financial risk management from reactive to predictive. By combining scenario modeling, stress testing, and regulatory compliance in one platform, WebMob helped the client deliver a system that serves risk managers, wealth advisors, traders, and compliance officers with real-time insights and data-driven decision support.


Ready to Build Your Own AI Platform?
Let us help you design and deliver a production-grade AI solution tailored to your industry and workflow.
More Projects