Glacier
Custom Financial Risk & Scenario Analysis Platform for Smarter Banking Decisions
services
Web
industry
Fintech
duration
3 months
country
Switzerland
Project Overview
Scenario Analysis Platform is a custom financial risk built for banks, asset managers, treasury teams, portfolio managers, credit officers, and financial analysts. At its core, the platform addresses a problem most financial institutions know well: critical decisions getting bottle-necked by fragmented spreadsheets, siloed tools, and manual risk workflows. Rather than patching together yet another layer of tools, we built Scenario Analysis Platform from scratch as a unified, browser-based environment. It brings scenario management, ALM analysis, Lombard credit risk, option margin analysis, portfolio optimization, and referential market data workflows into one place, with the security, governance, and scalability that enterprise finance teams actually need.

The Challenges
Fragmented Risk Workflows
Spreadsheet-Driven Processes
Limited Visibility Across Teams
Complex Financial Calculations
Security and Compliance Requirements
Scalability for Future Expansion
Our Solution
Unified Cloud-Ready Platform
Structured Frontend and Computation Engine
Enterprise-Grade Security and Infrastructure
Features Implemented
Scenario Analysis Platform includes a comprehensive set of features designed for financial risk analysis, scenario management, portfolio optimization, and much more.
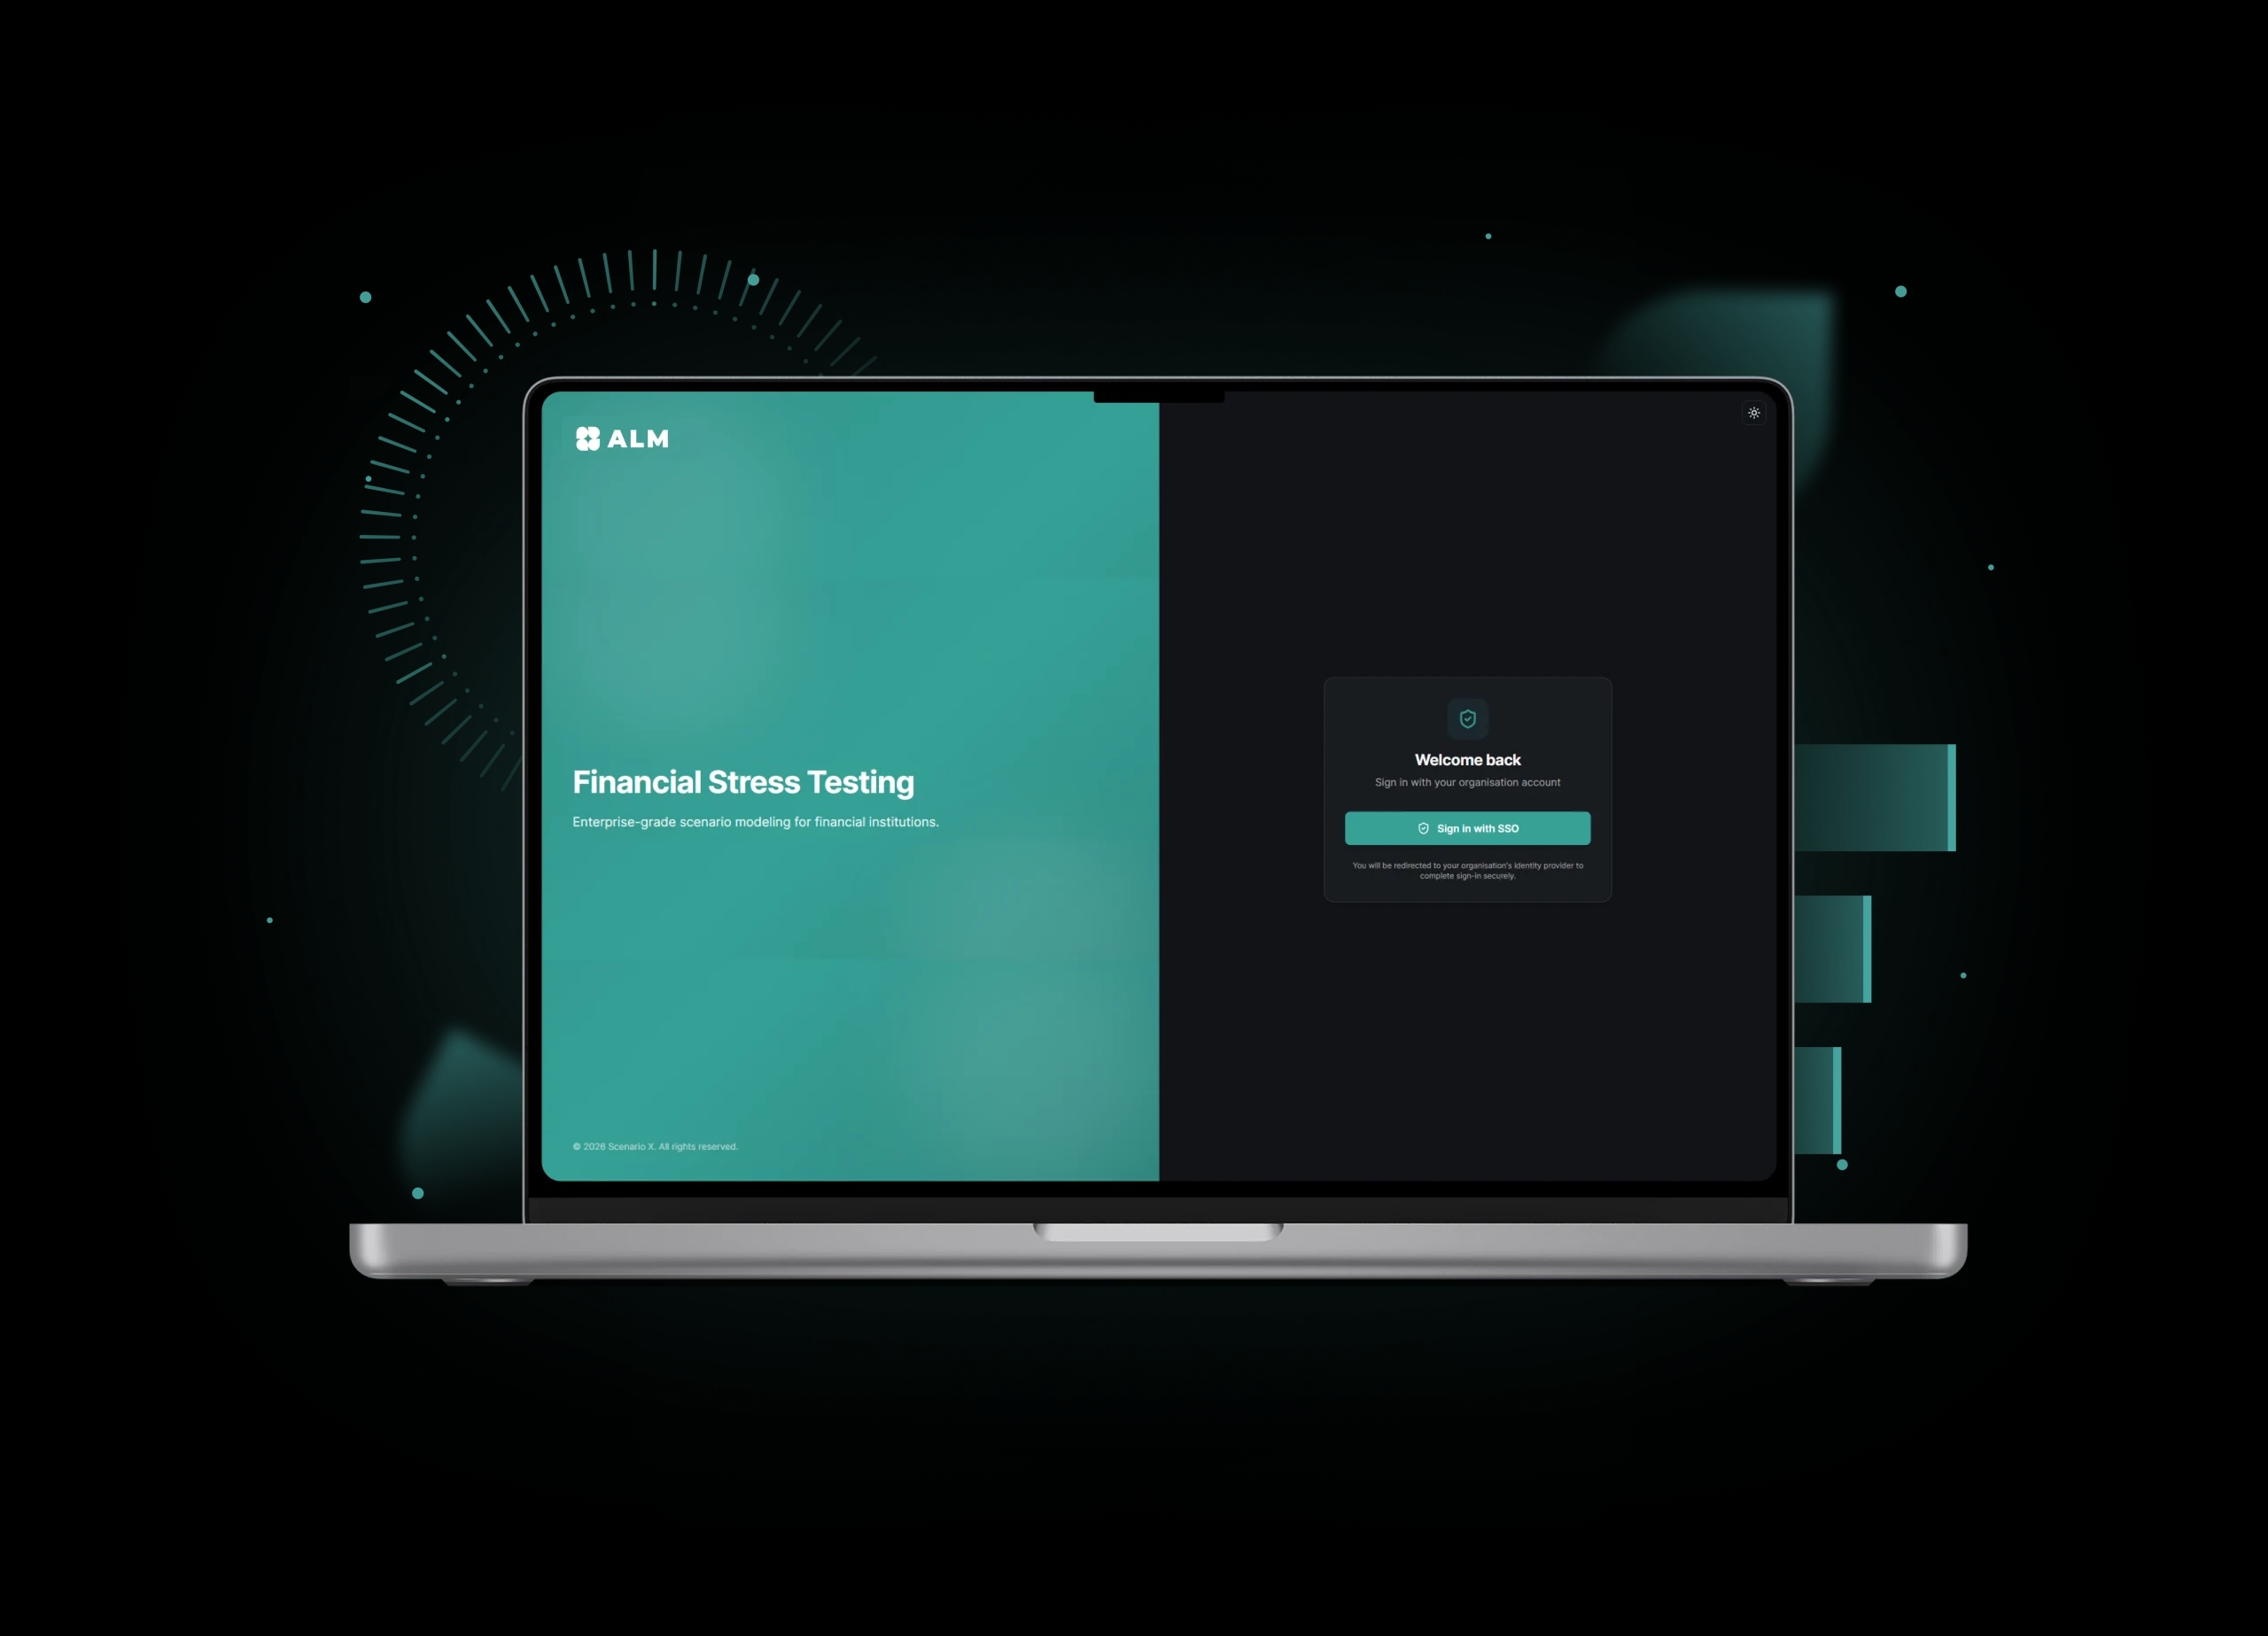
1. Secure SSO-Based Login
We built the login experience around organization-based single sign-on, authenticated through the institution's own identity provider. This is more than a UX decision. It means every user entering the platform has been verified by their organization before they ever see a single financial workflow. It also means IT teams retain full control over access without managing a separate credential system inside scenario analysis platform.
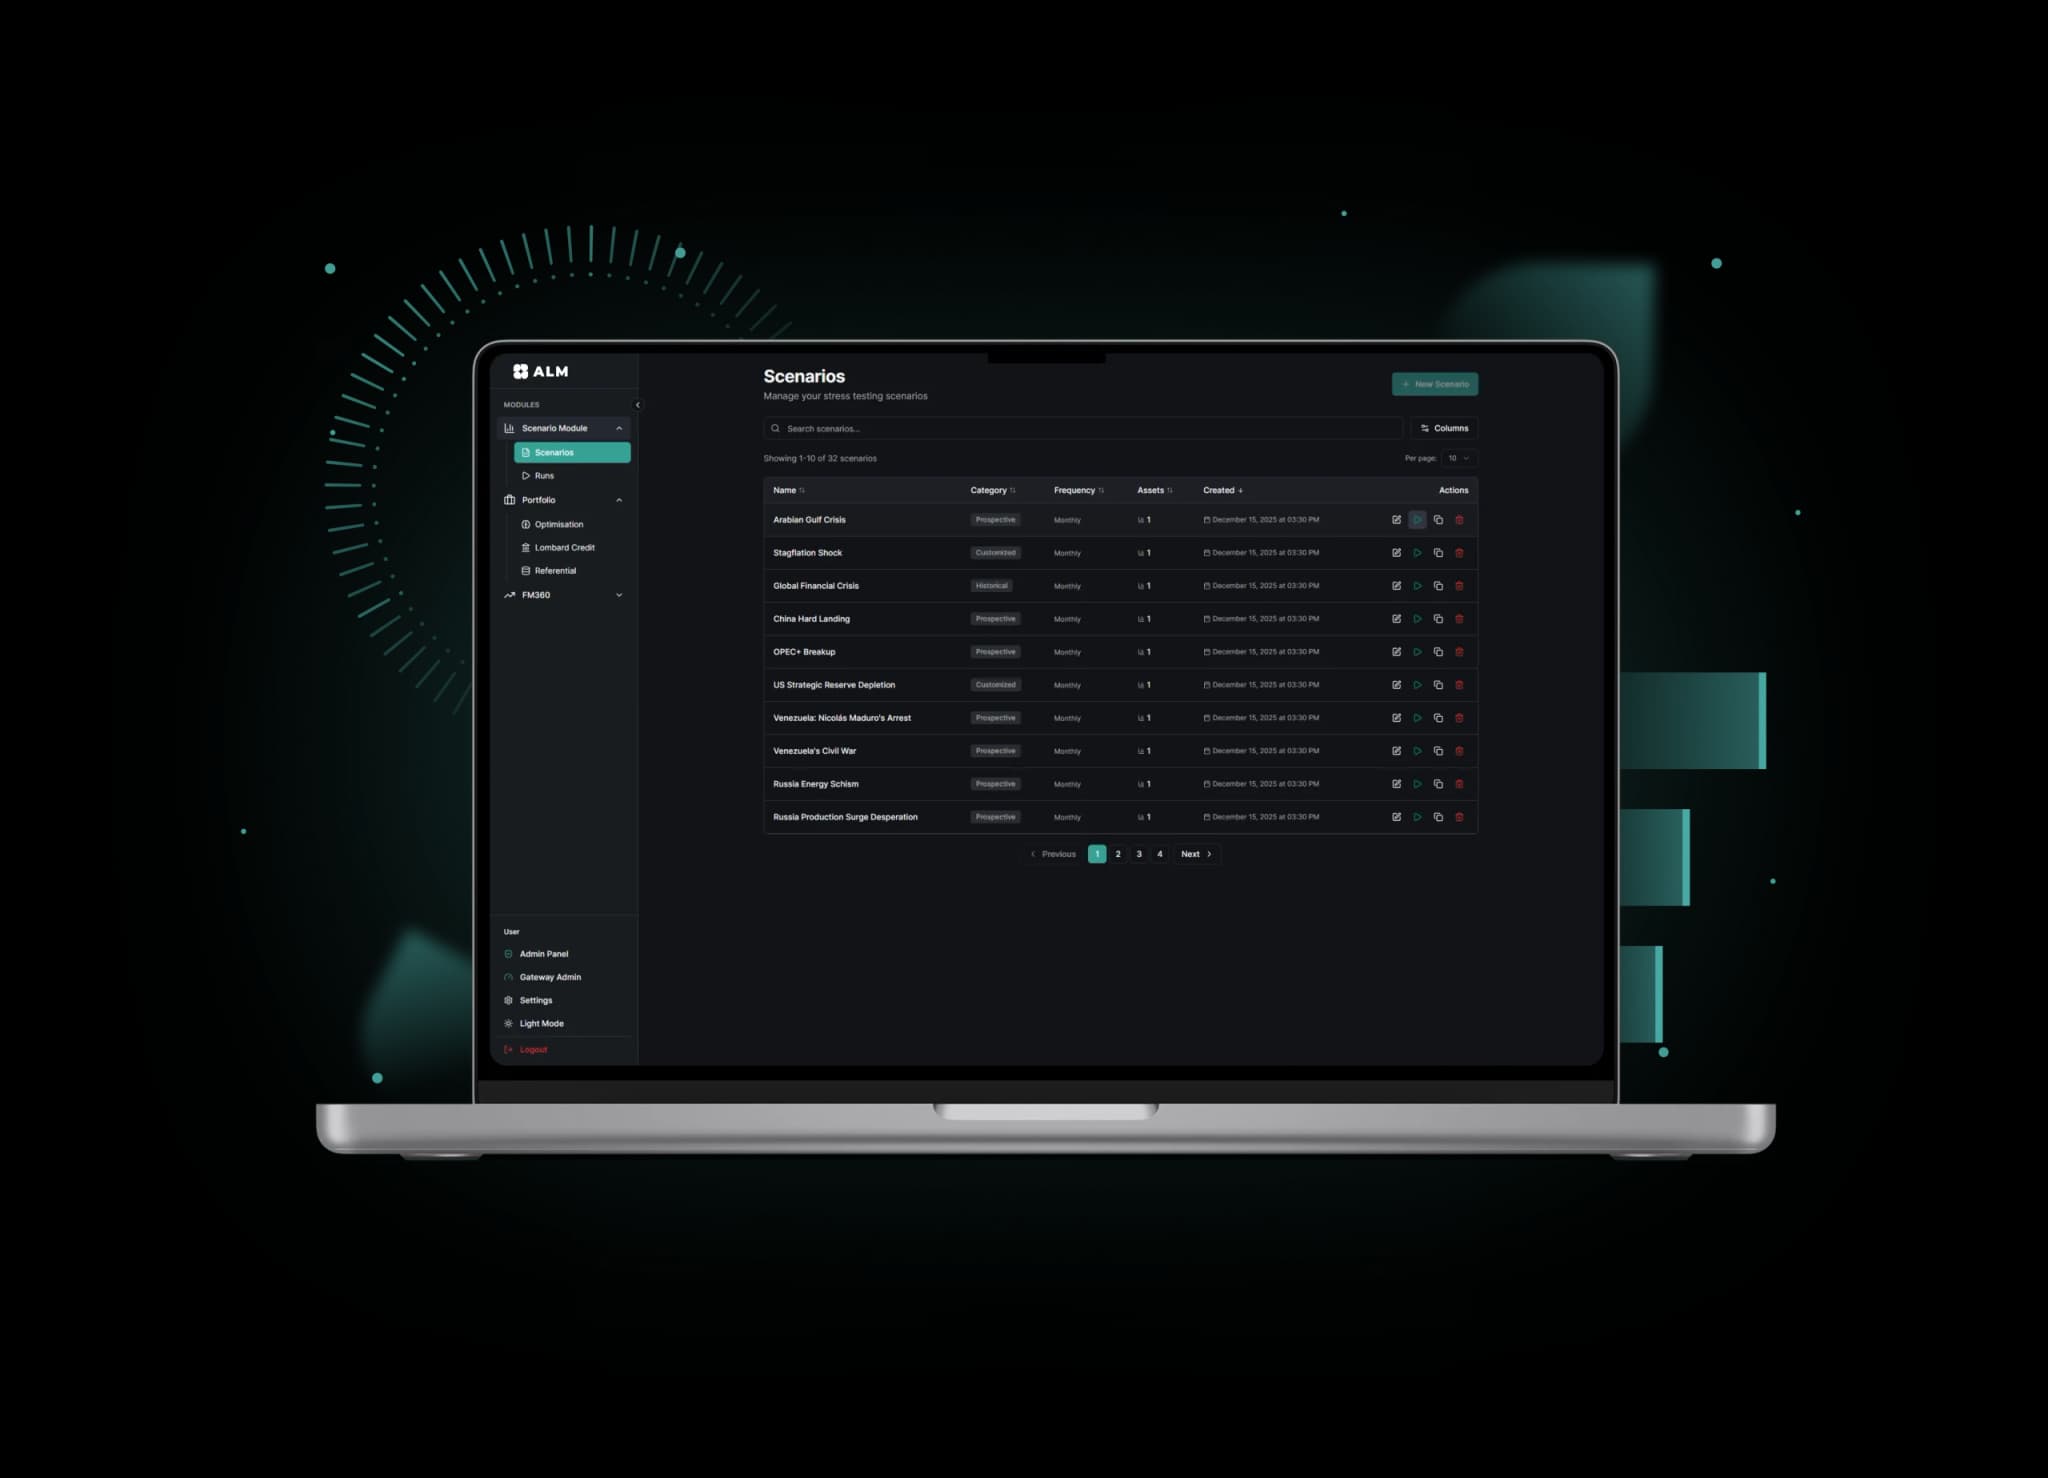
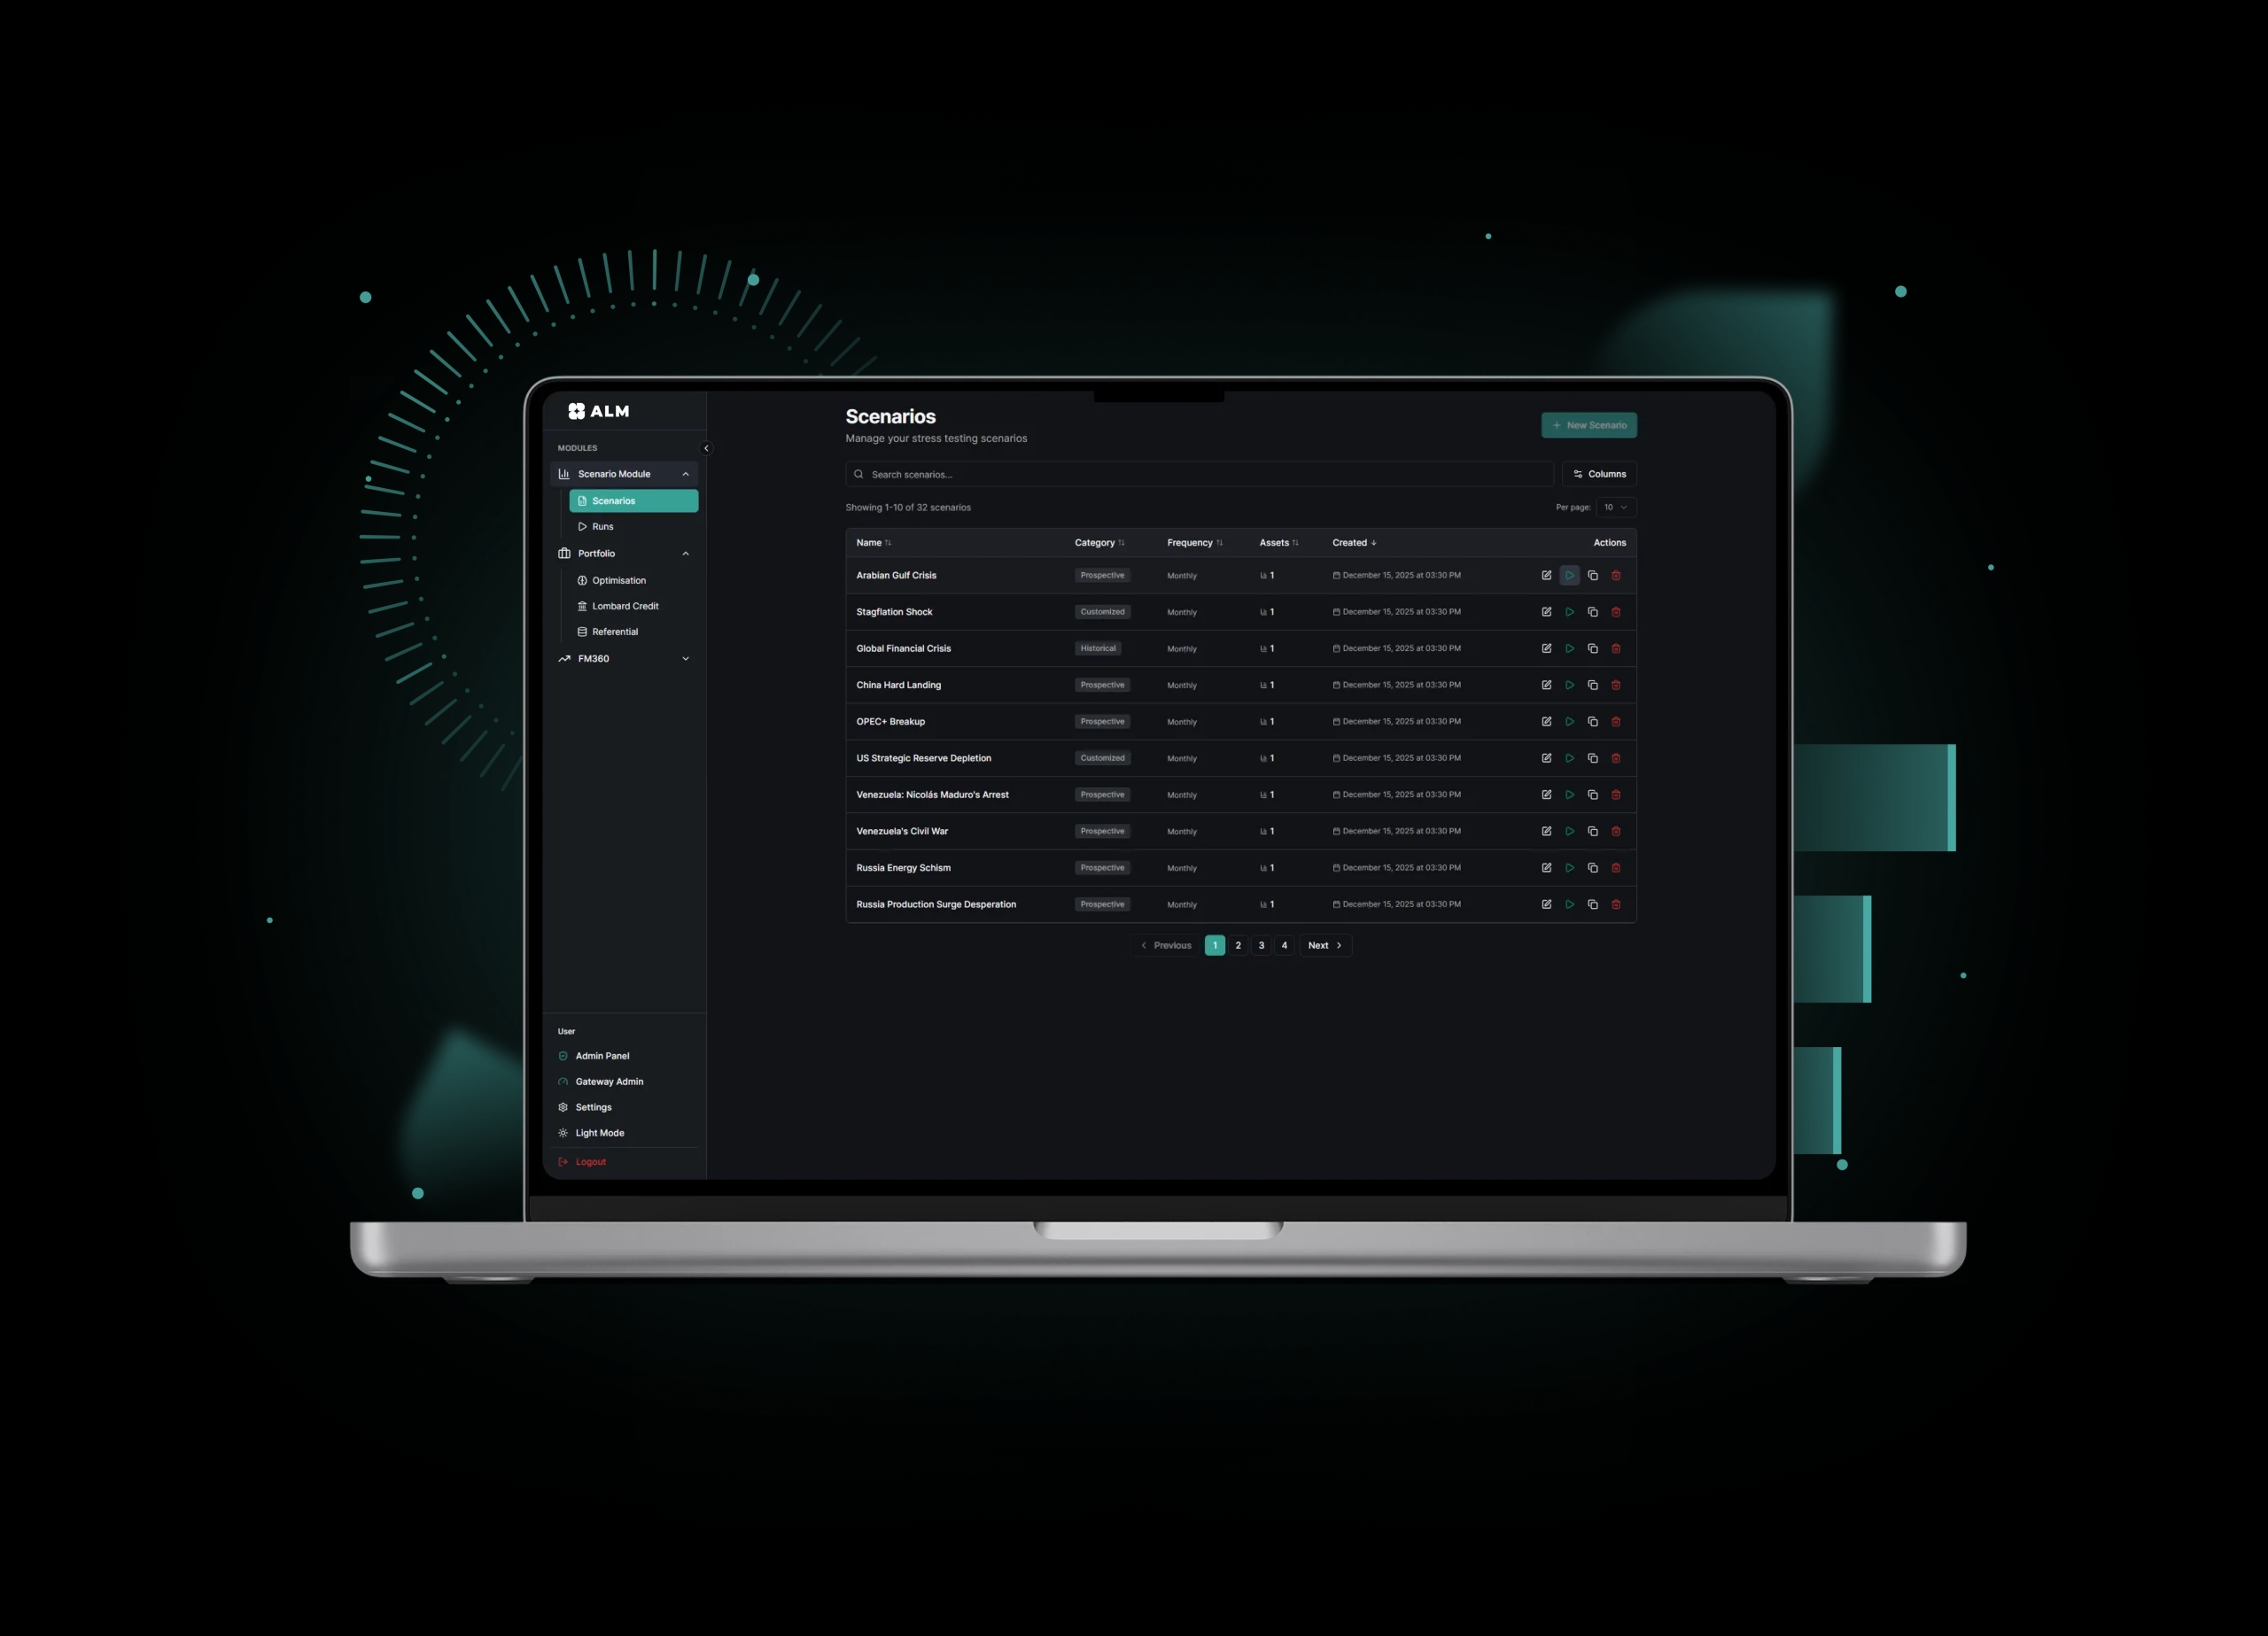
2. Scenario Management
The Scenario Management screen gives risk teams a centralized place to manage financial stress testing scenarios. Users can see all scenarios in one list, with scenario name, category, frequency, linked assets, and creation date, and search, filter, or paginate through them. Creating new scenarios and organizing assumptions in a structured way replaces the old pattern of scattered spreadsheet-based records that were hard to version and harder to audit.
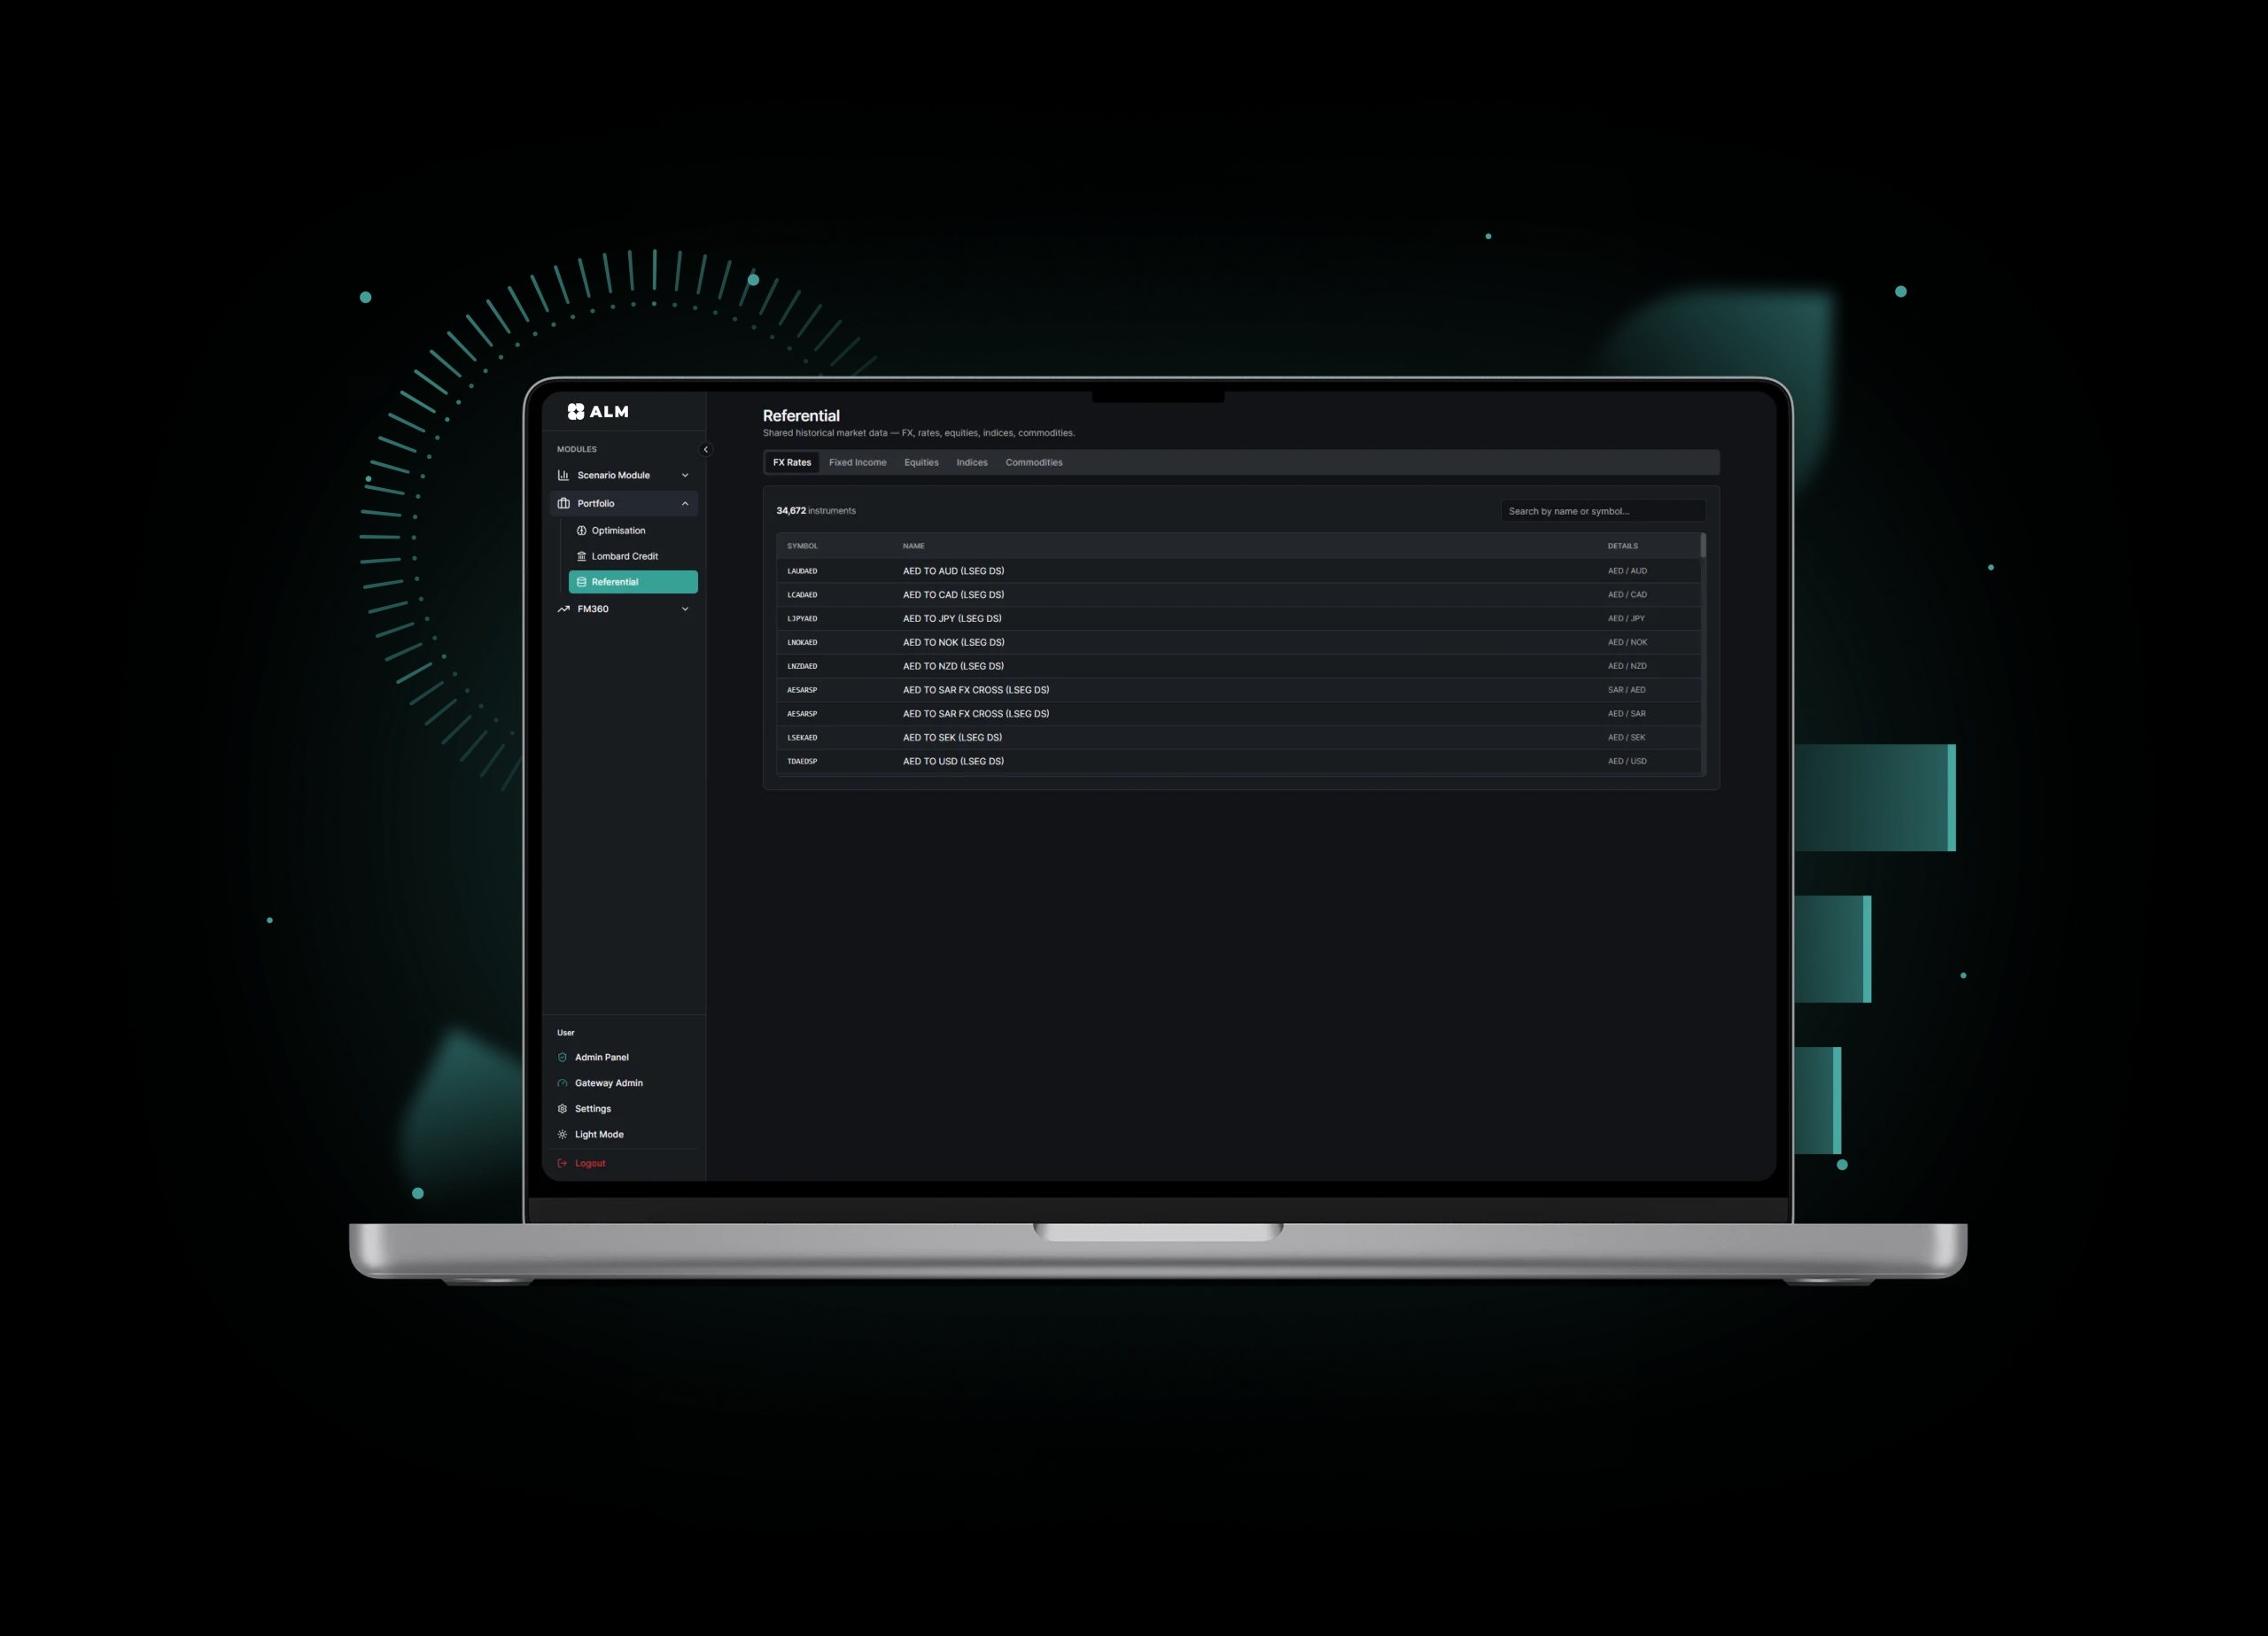
3. Referential Market Data
Analysts and risk teams get direct access to financial instruments and their historical market data. Users can search by name or symbol, pull up detailed instrument records, and view historical price movement through visual charts with flexible time-range filters. Having this layer built into the platform means teams no longer need to cross-reference external data sources when building scenarios or running analysis.
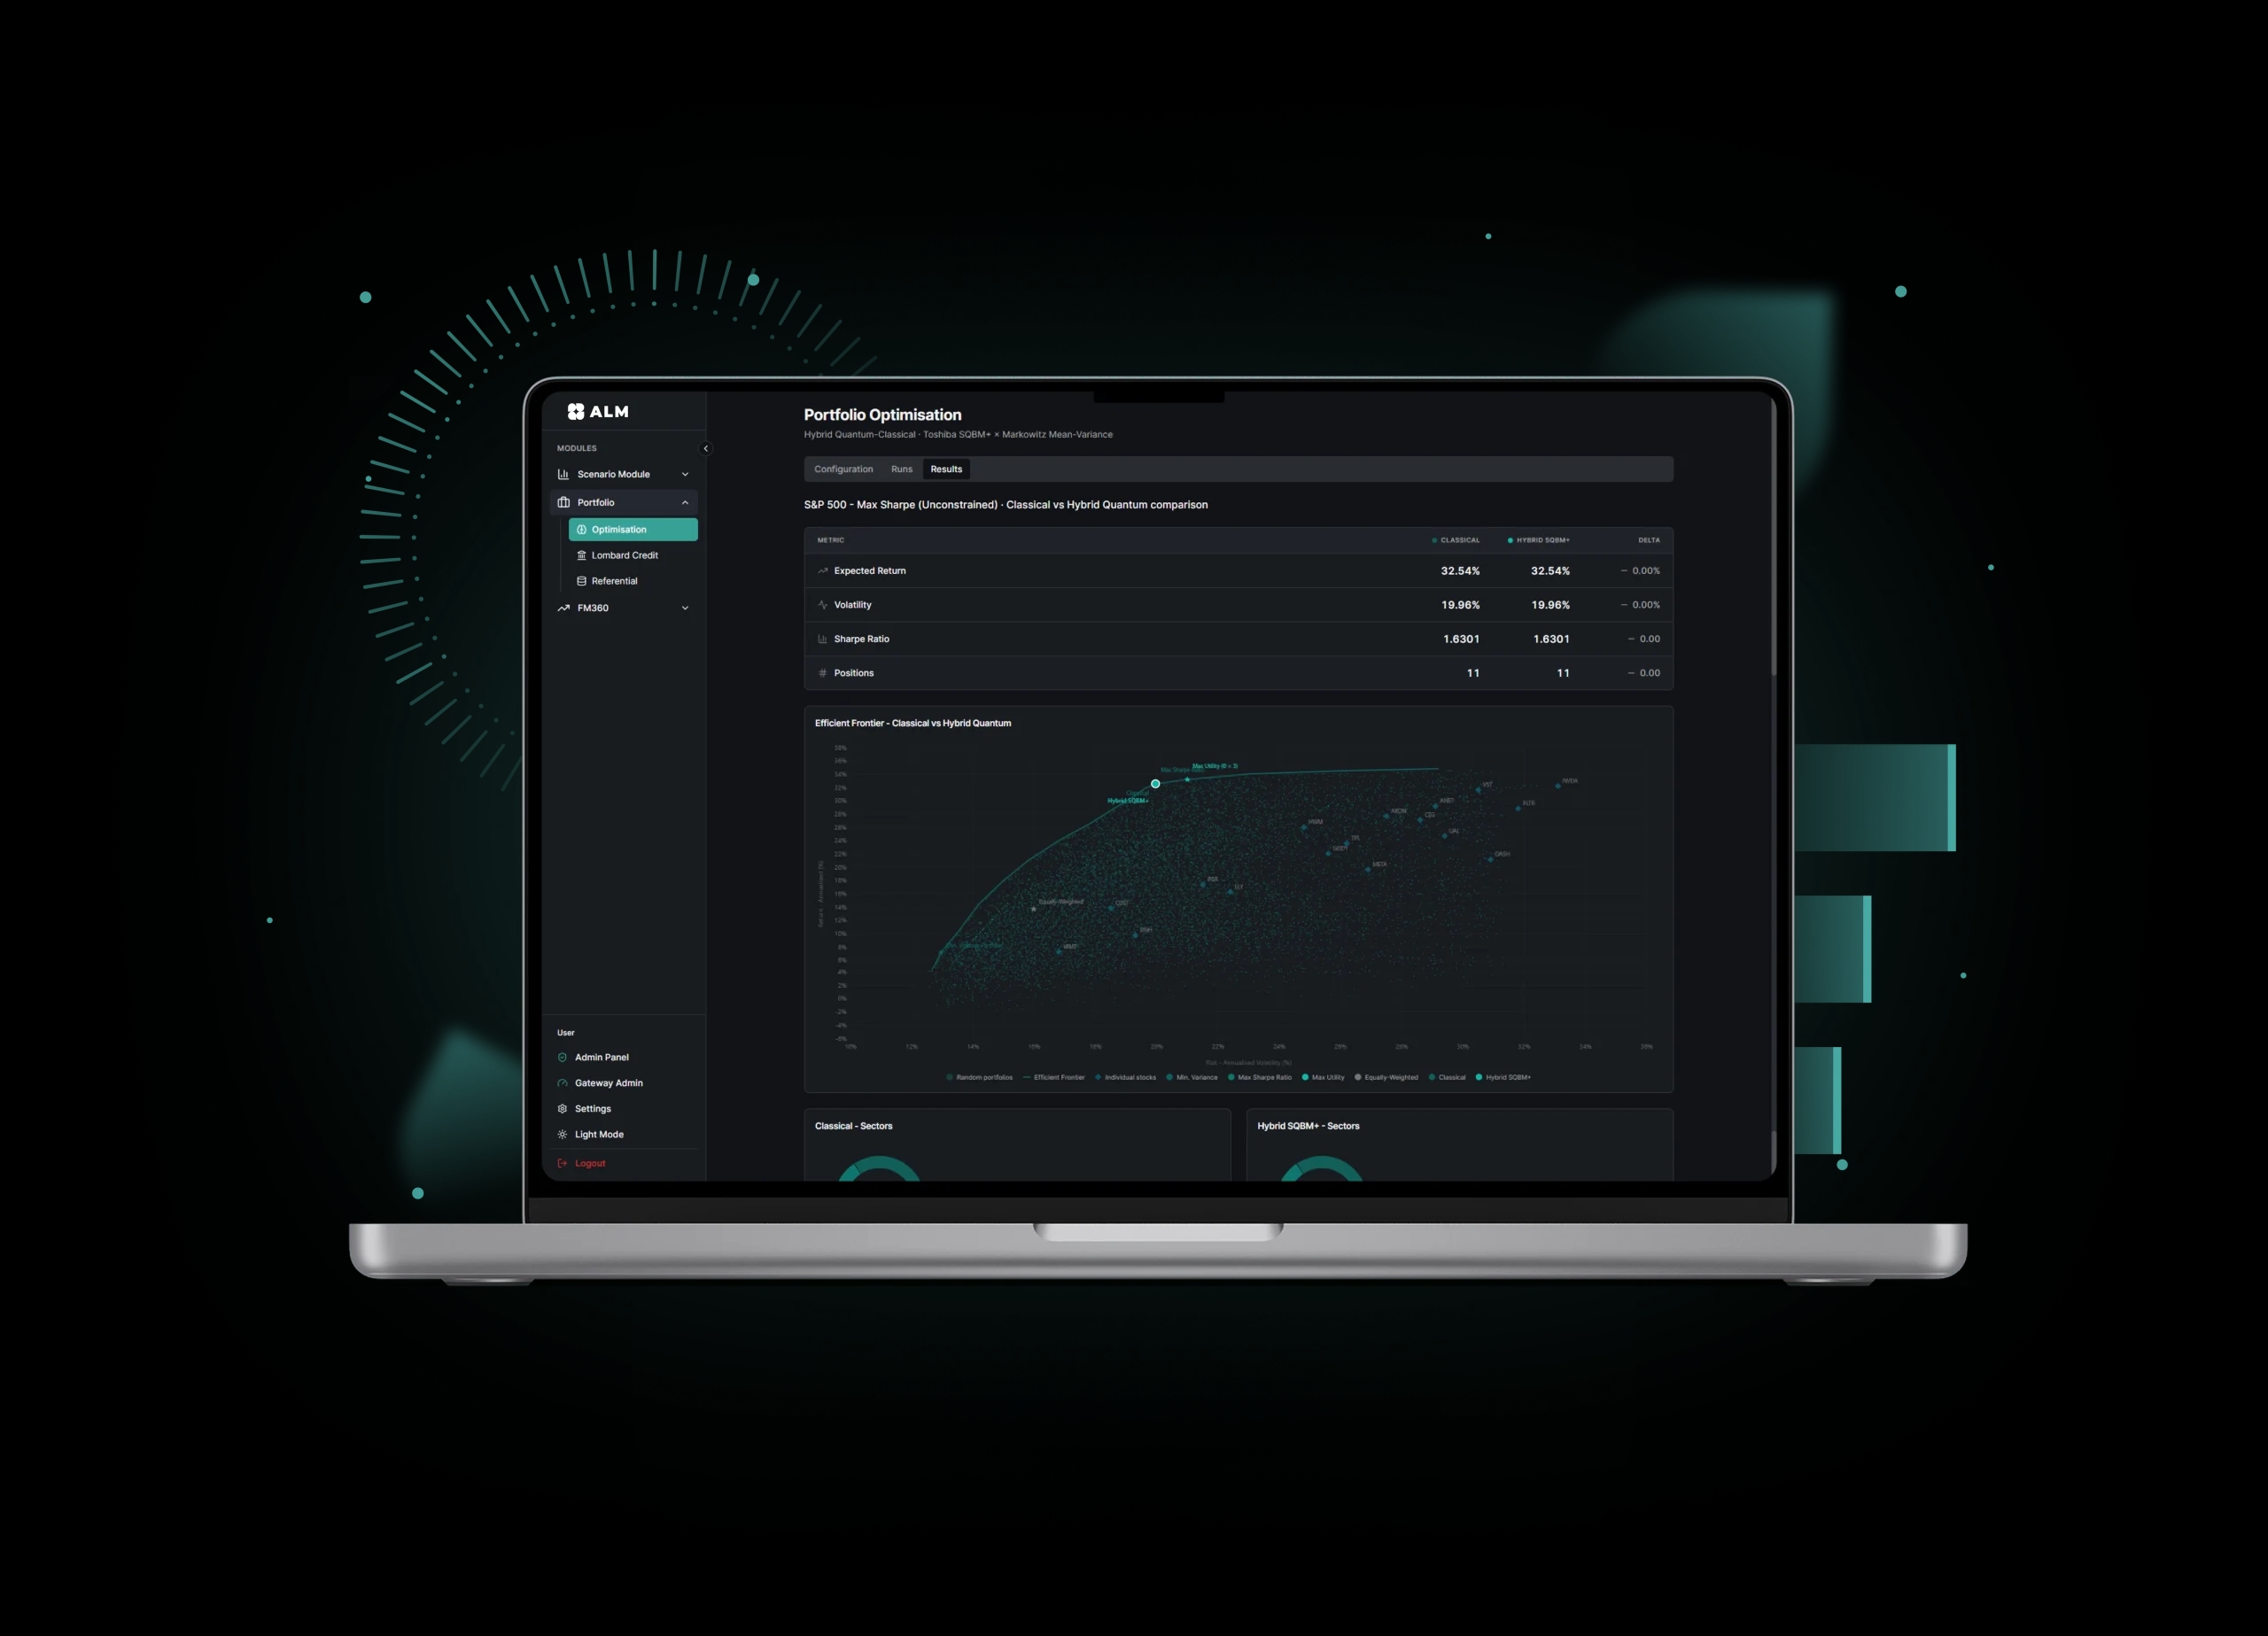
4. Portfolio Optimization
This module lets portfolio managers compare classical optimization results against hybrid quantum optimization outputs side by side. Key metrics including expected return, volatility, Sharpe ratio, and position count are displayed alongside an efficient frontier chart that makes the risk-return tradeoff immediately visible. The integration with Toshiba SQBM+ brings genuine optimization capability that goes well beyond what conventional portfolio tools can offer.
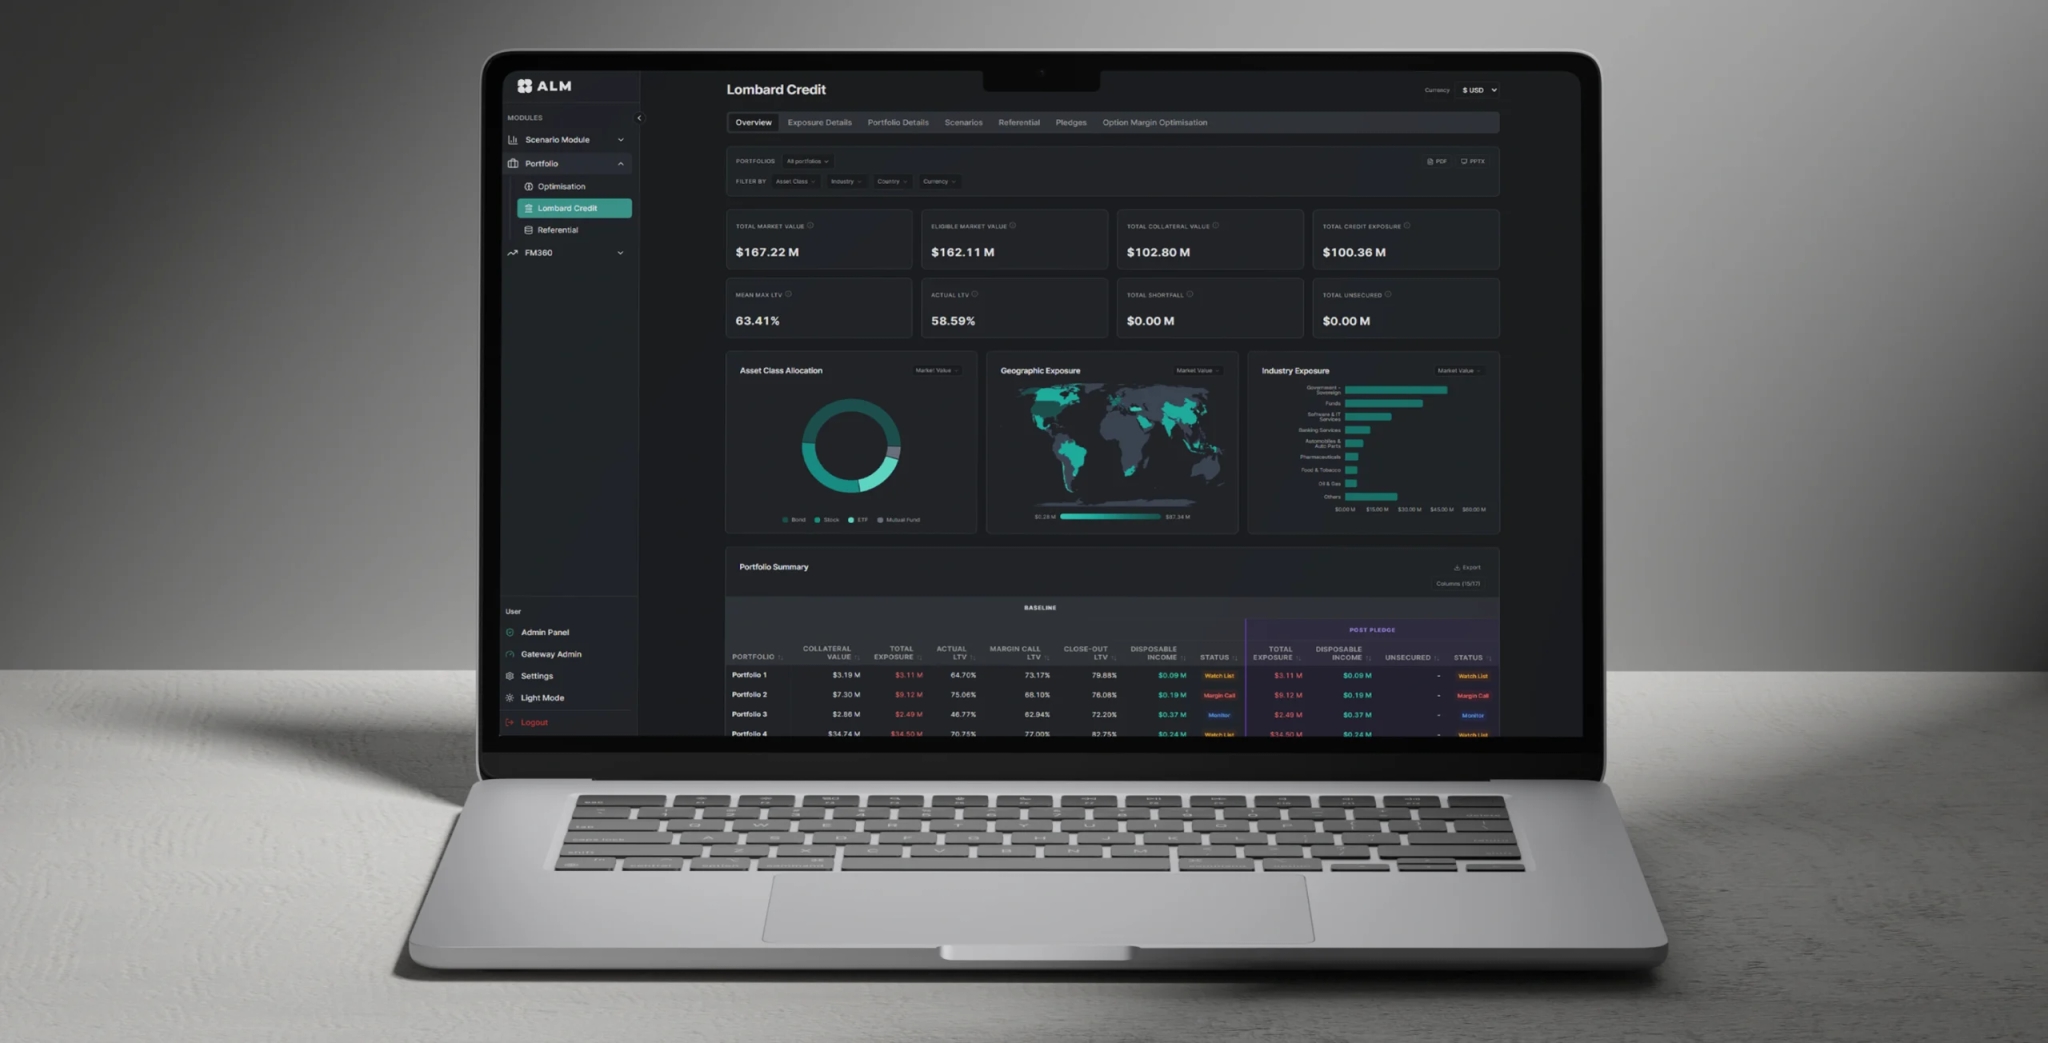
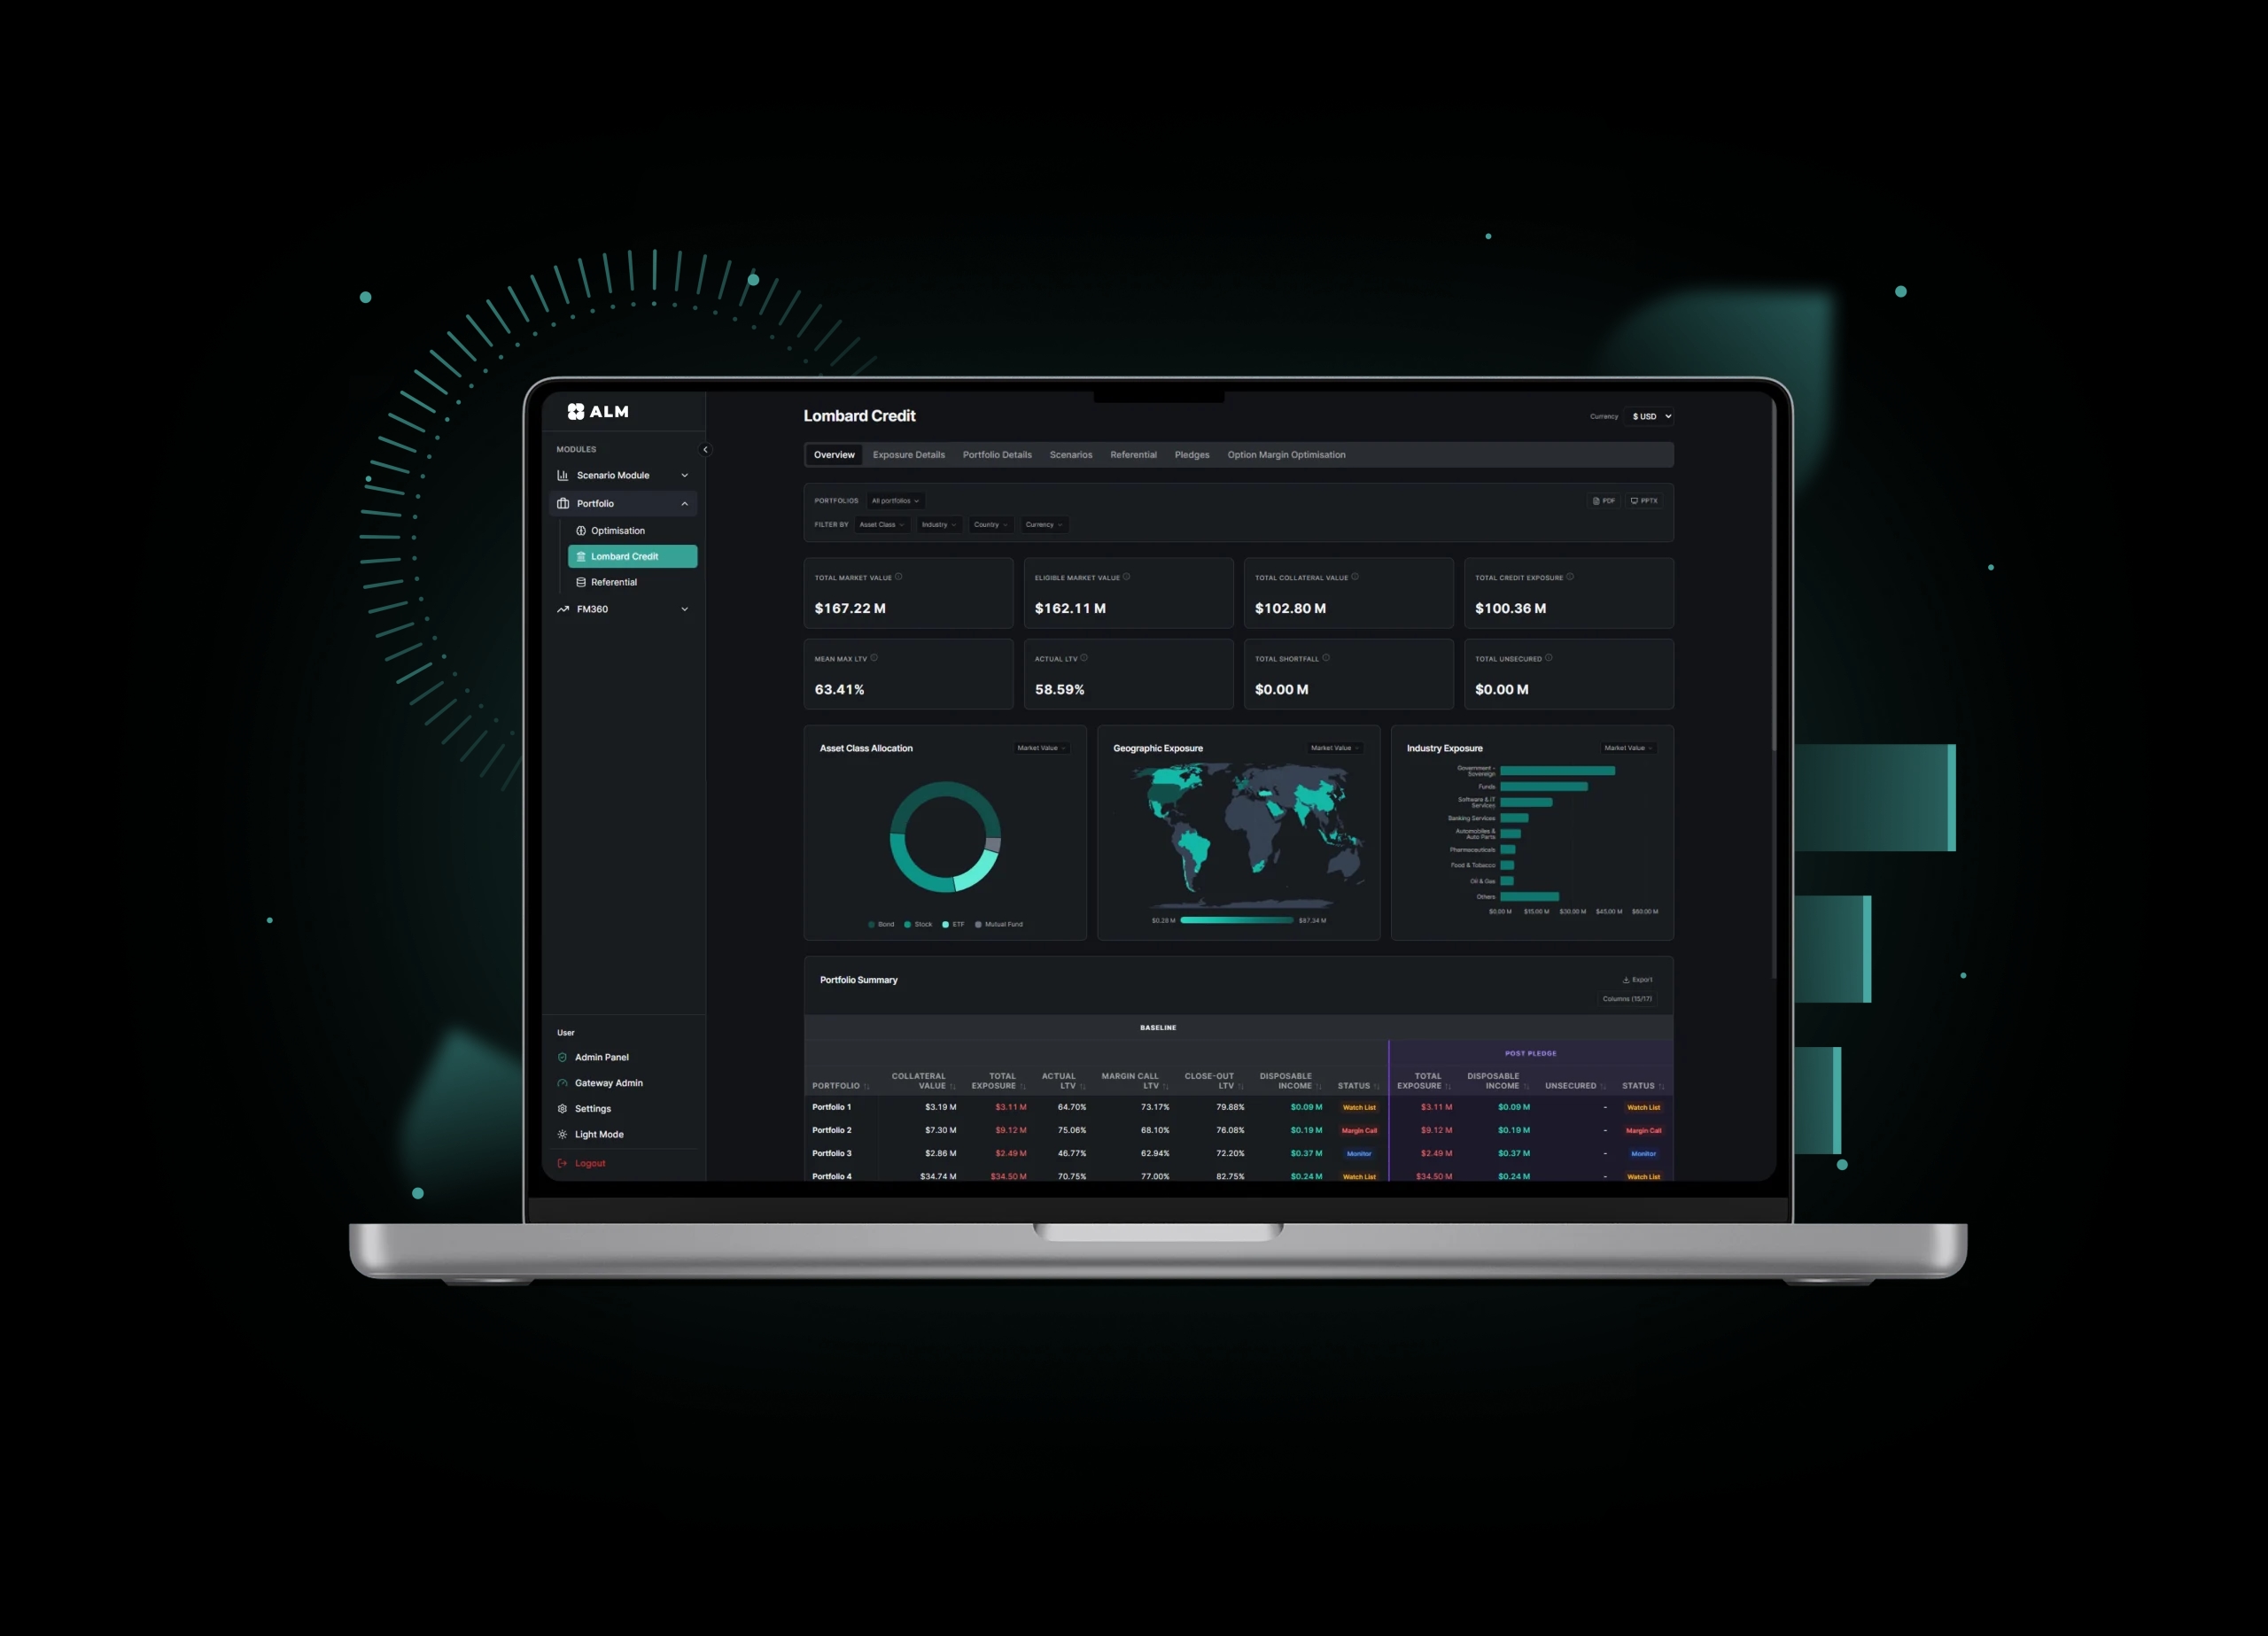
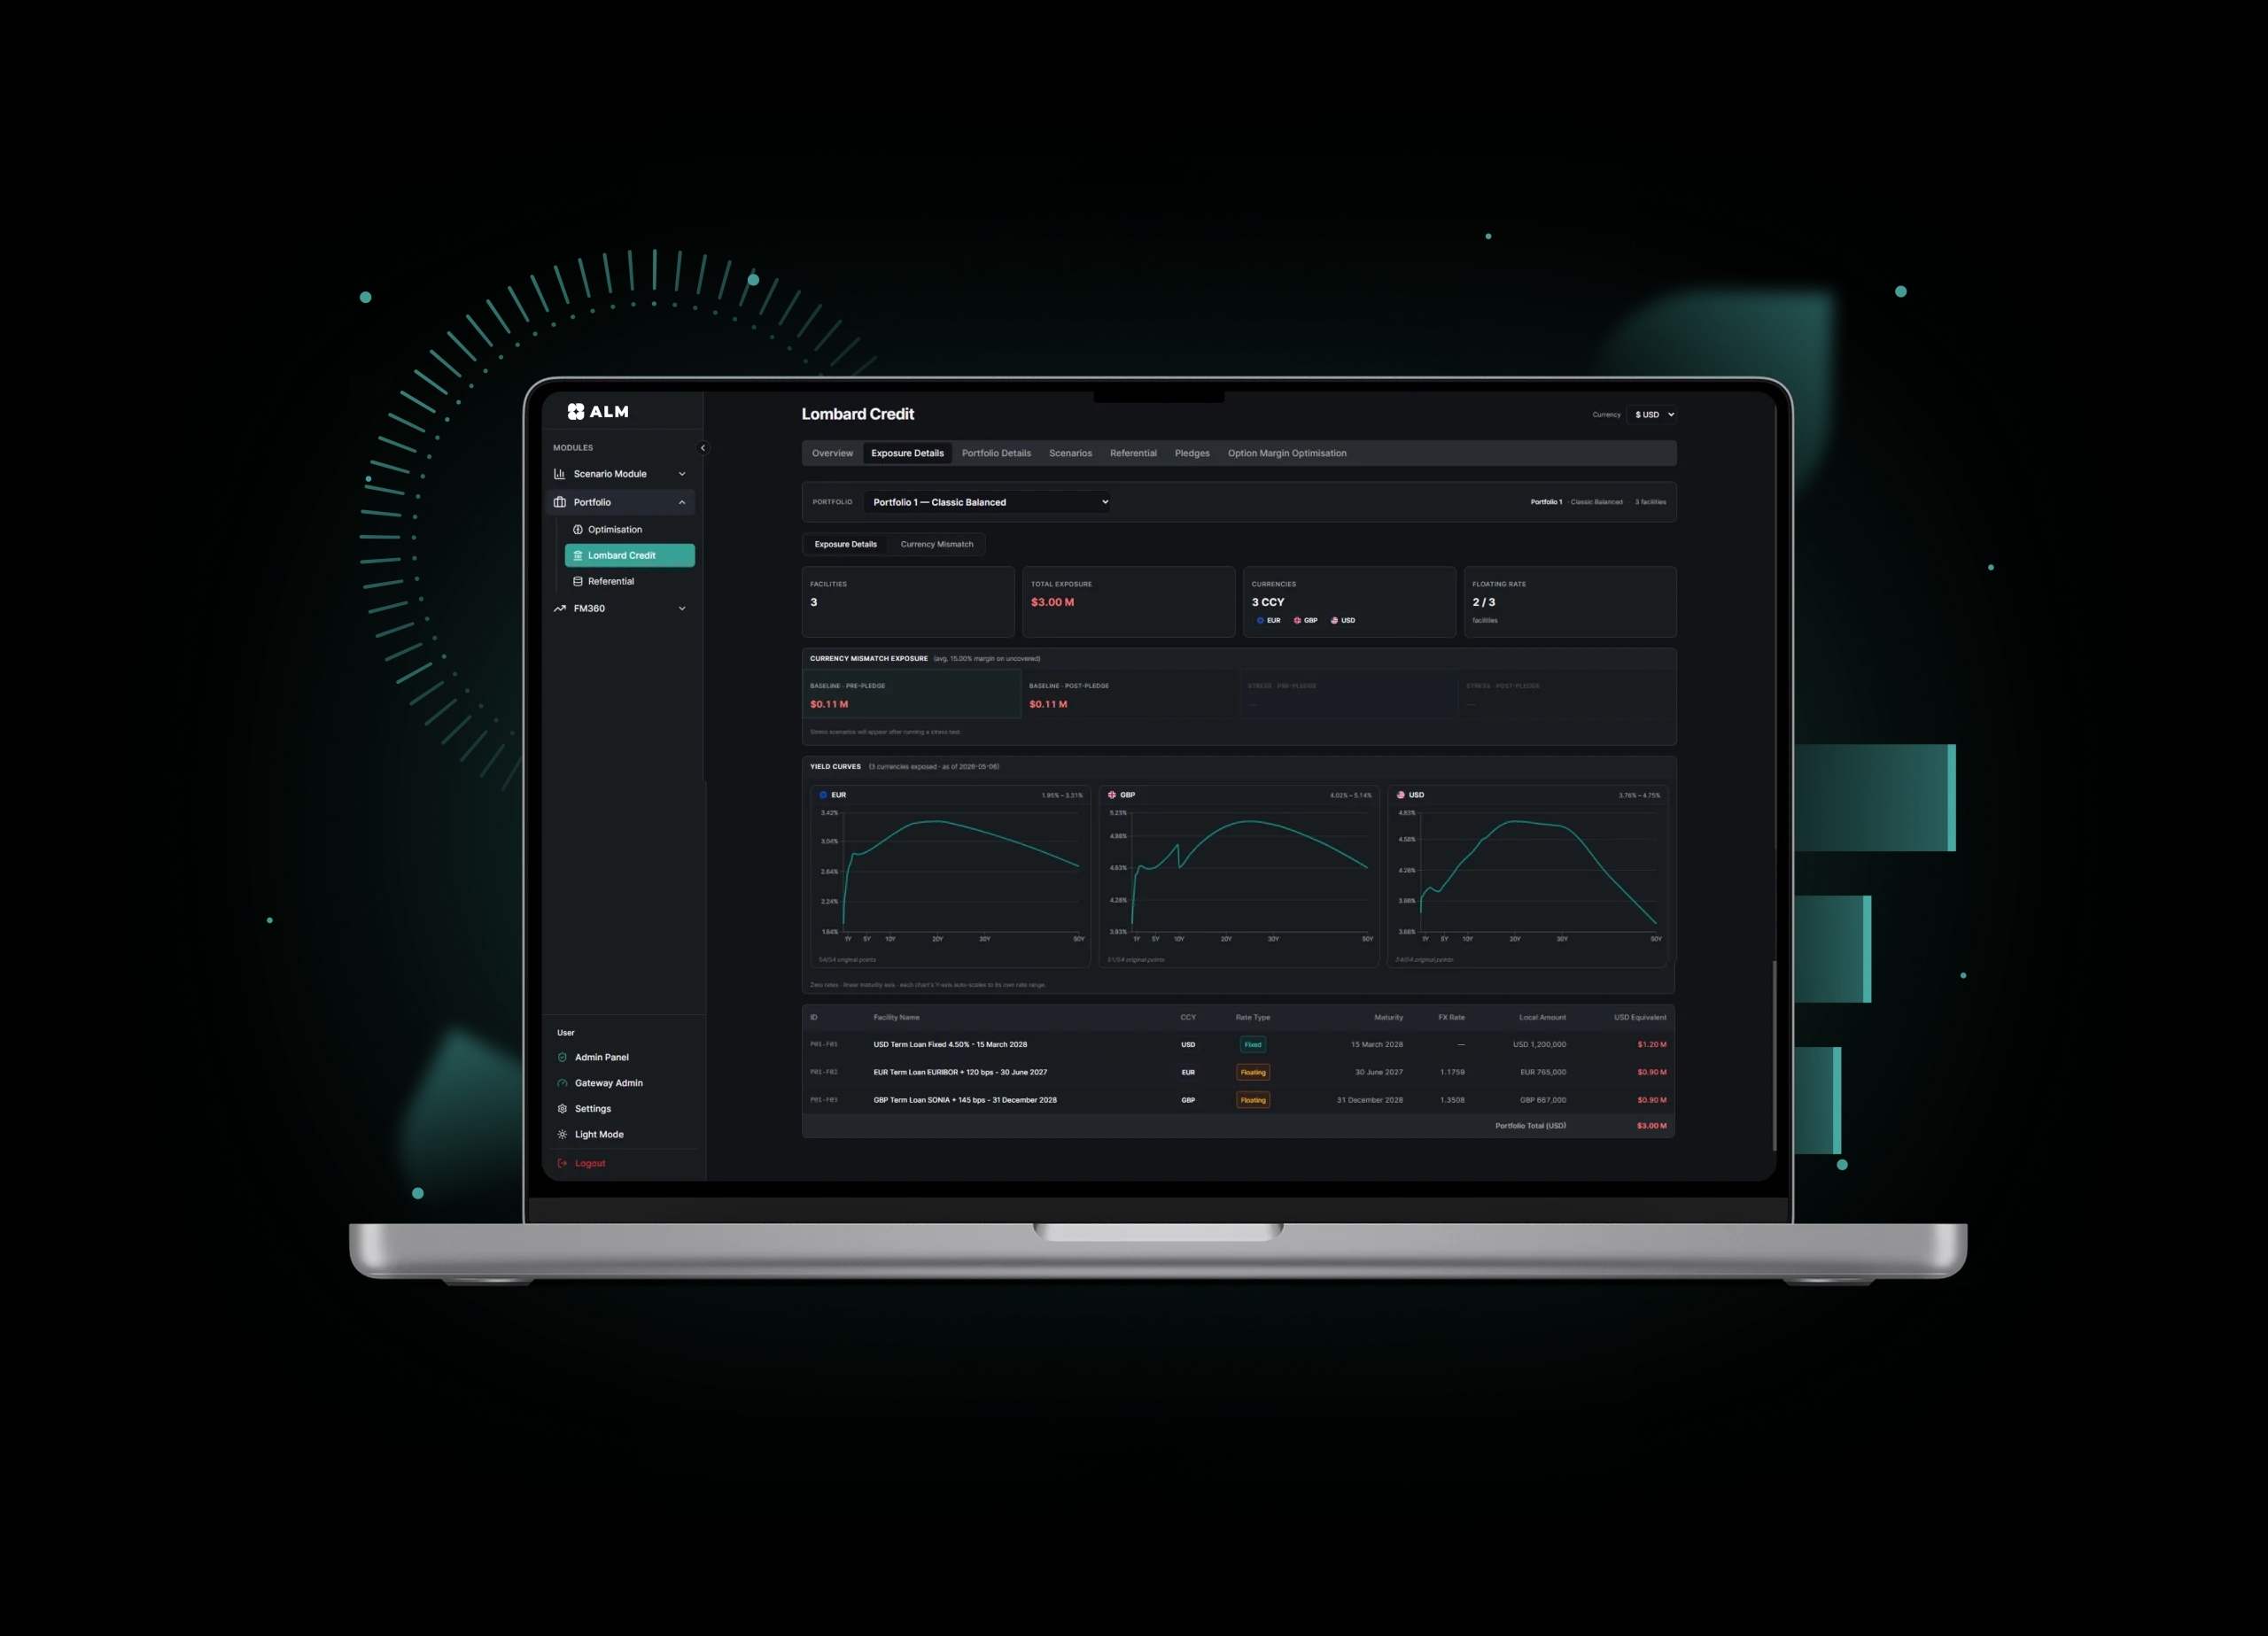
5. Lombard Credit Overview
The Lombard Credit Overview gives credit officers a complete picture of collateral-backed lending exposure. KPIs like total market value, eligible market value, total collateral value, total credit exposure, mean max LTV, actual LTV, total shortfall, and total unsecured amount are displayed upfront. Filters for portfolio, asset class, industry, country, and currency, combined with visual widgets for allocation and concentration, make it straightforward to spot where risk is concentrated and where shortfalls are emerging.
6. Lombard Credit Derivatives Portfolio
For margin and derivatives exposure, this screen surfaces the metrics that matter: net MTM, derivatives MTM, gross notional amount, net notional amount, and net initial margin. Users can switch between baseline, stress, margin, notional, AI-weighted, and DIY-weighted views depending on what they need to examine. This gives credit and risk teams a practical tool for understanding derivatives exposure without having to build it manually from raw position data.
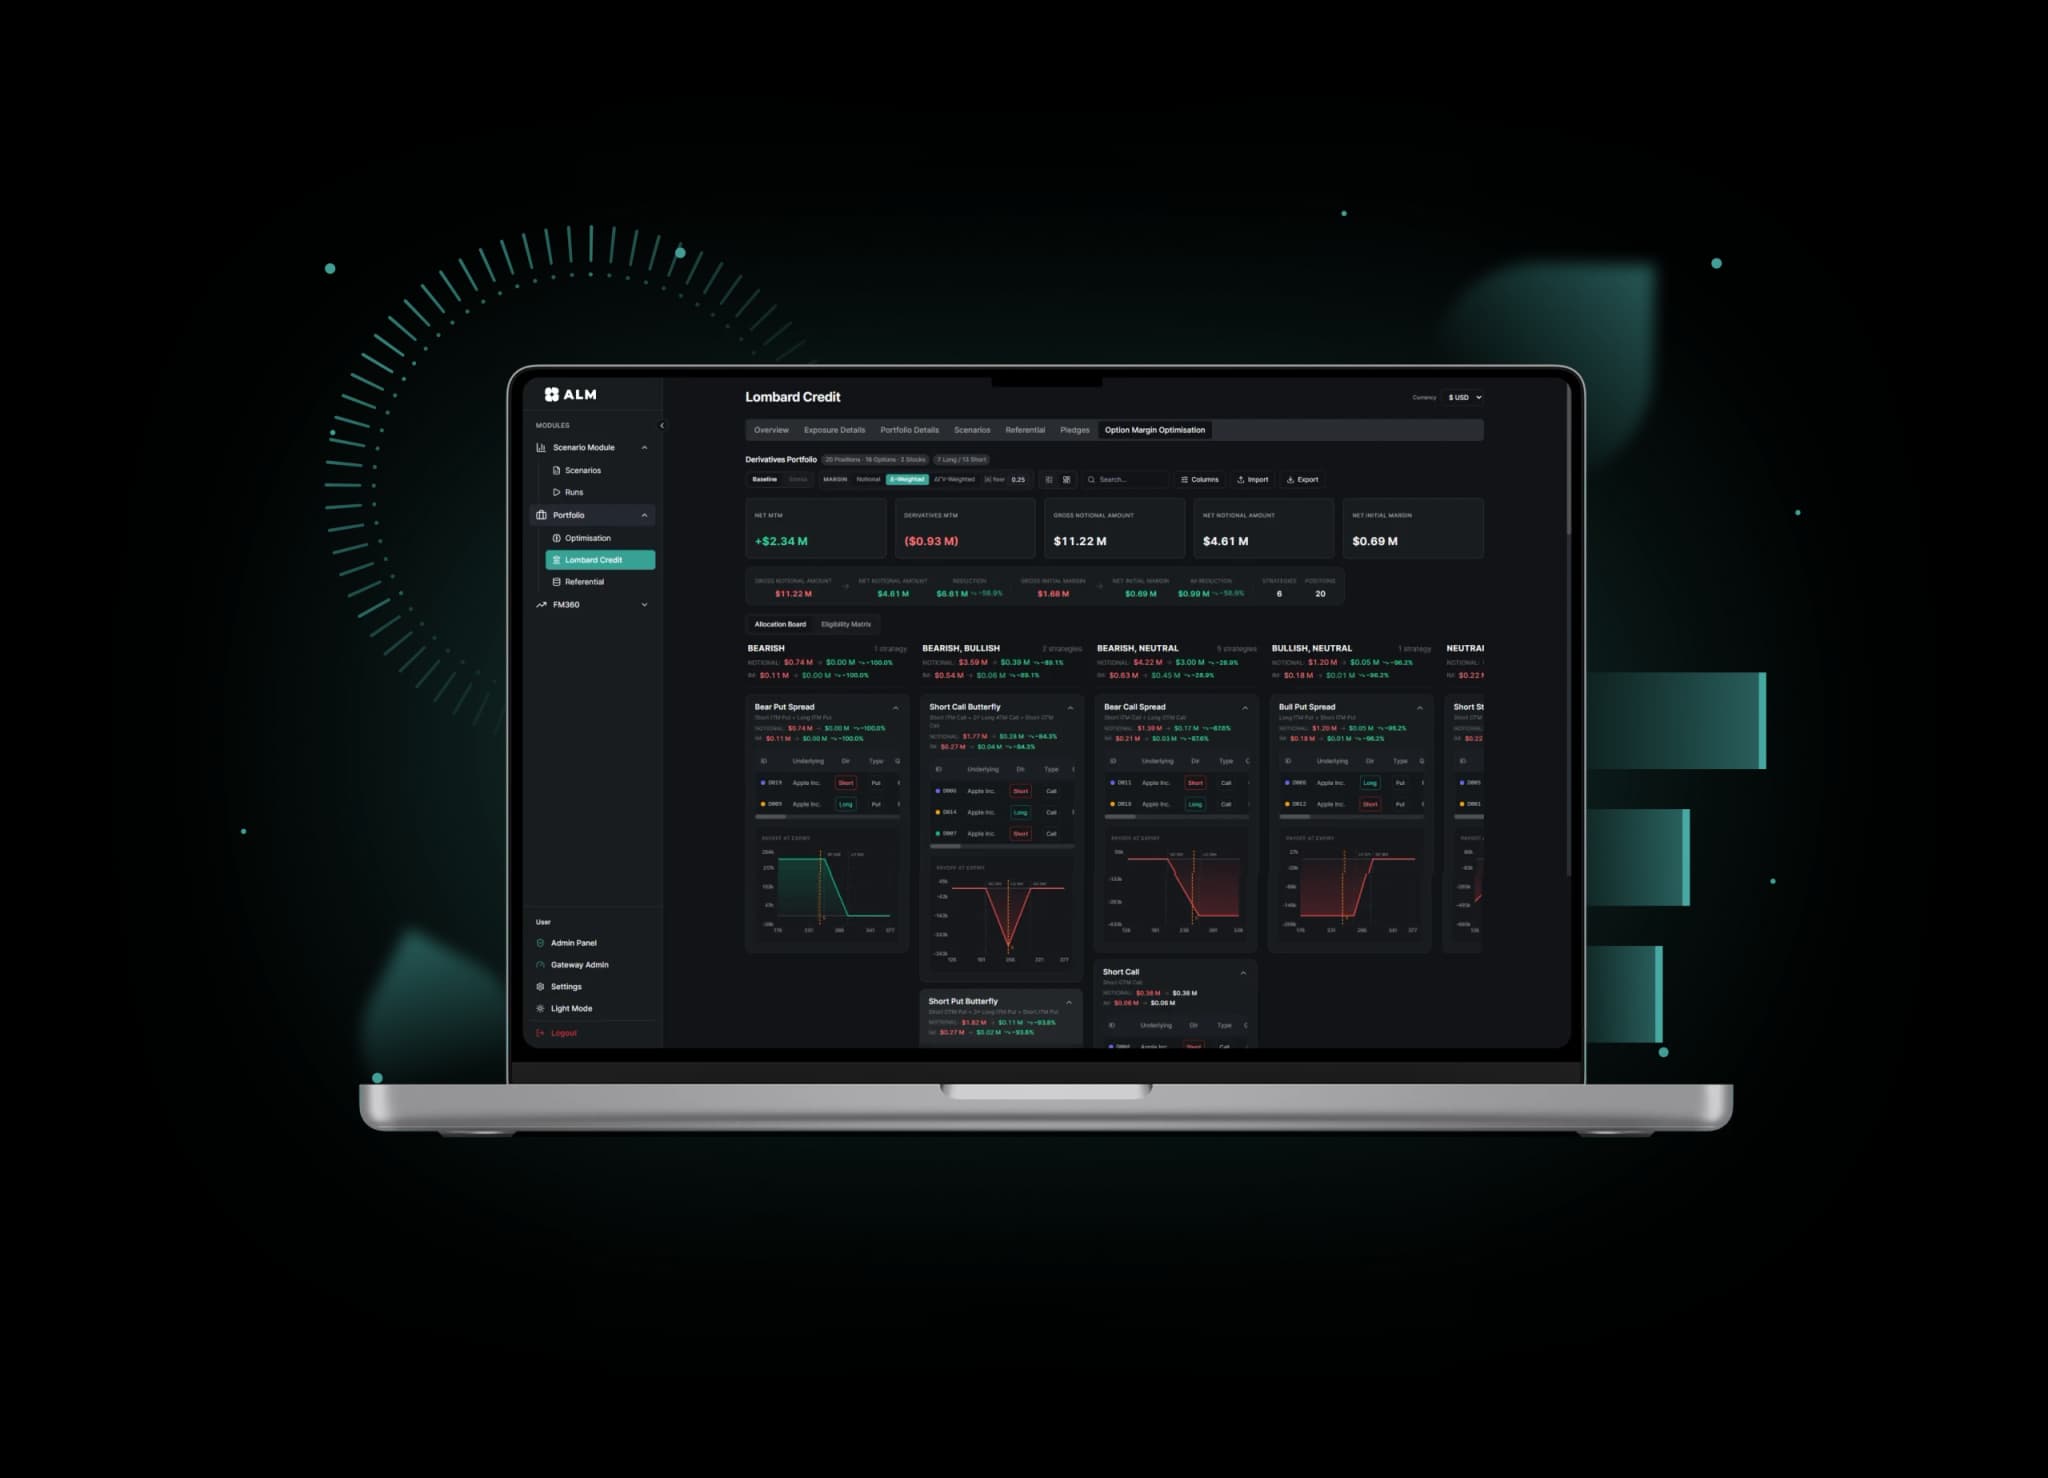
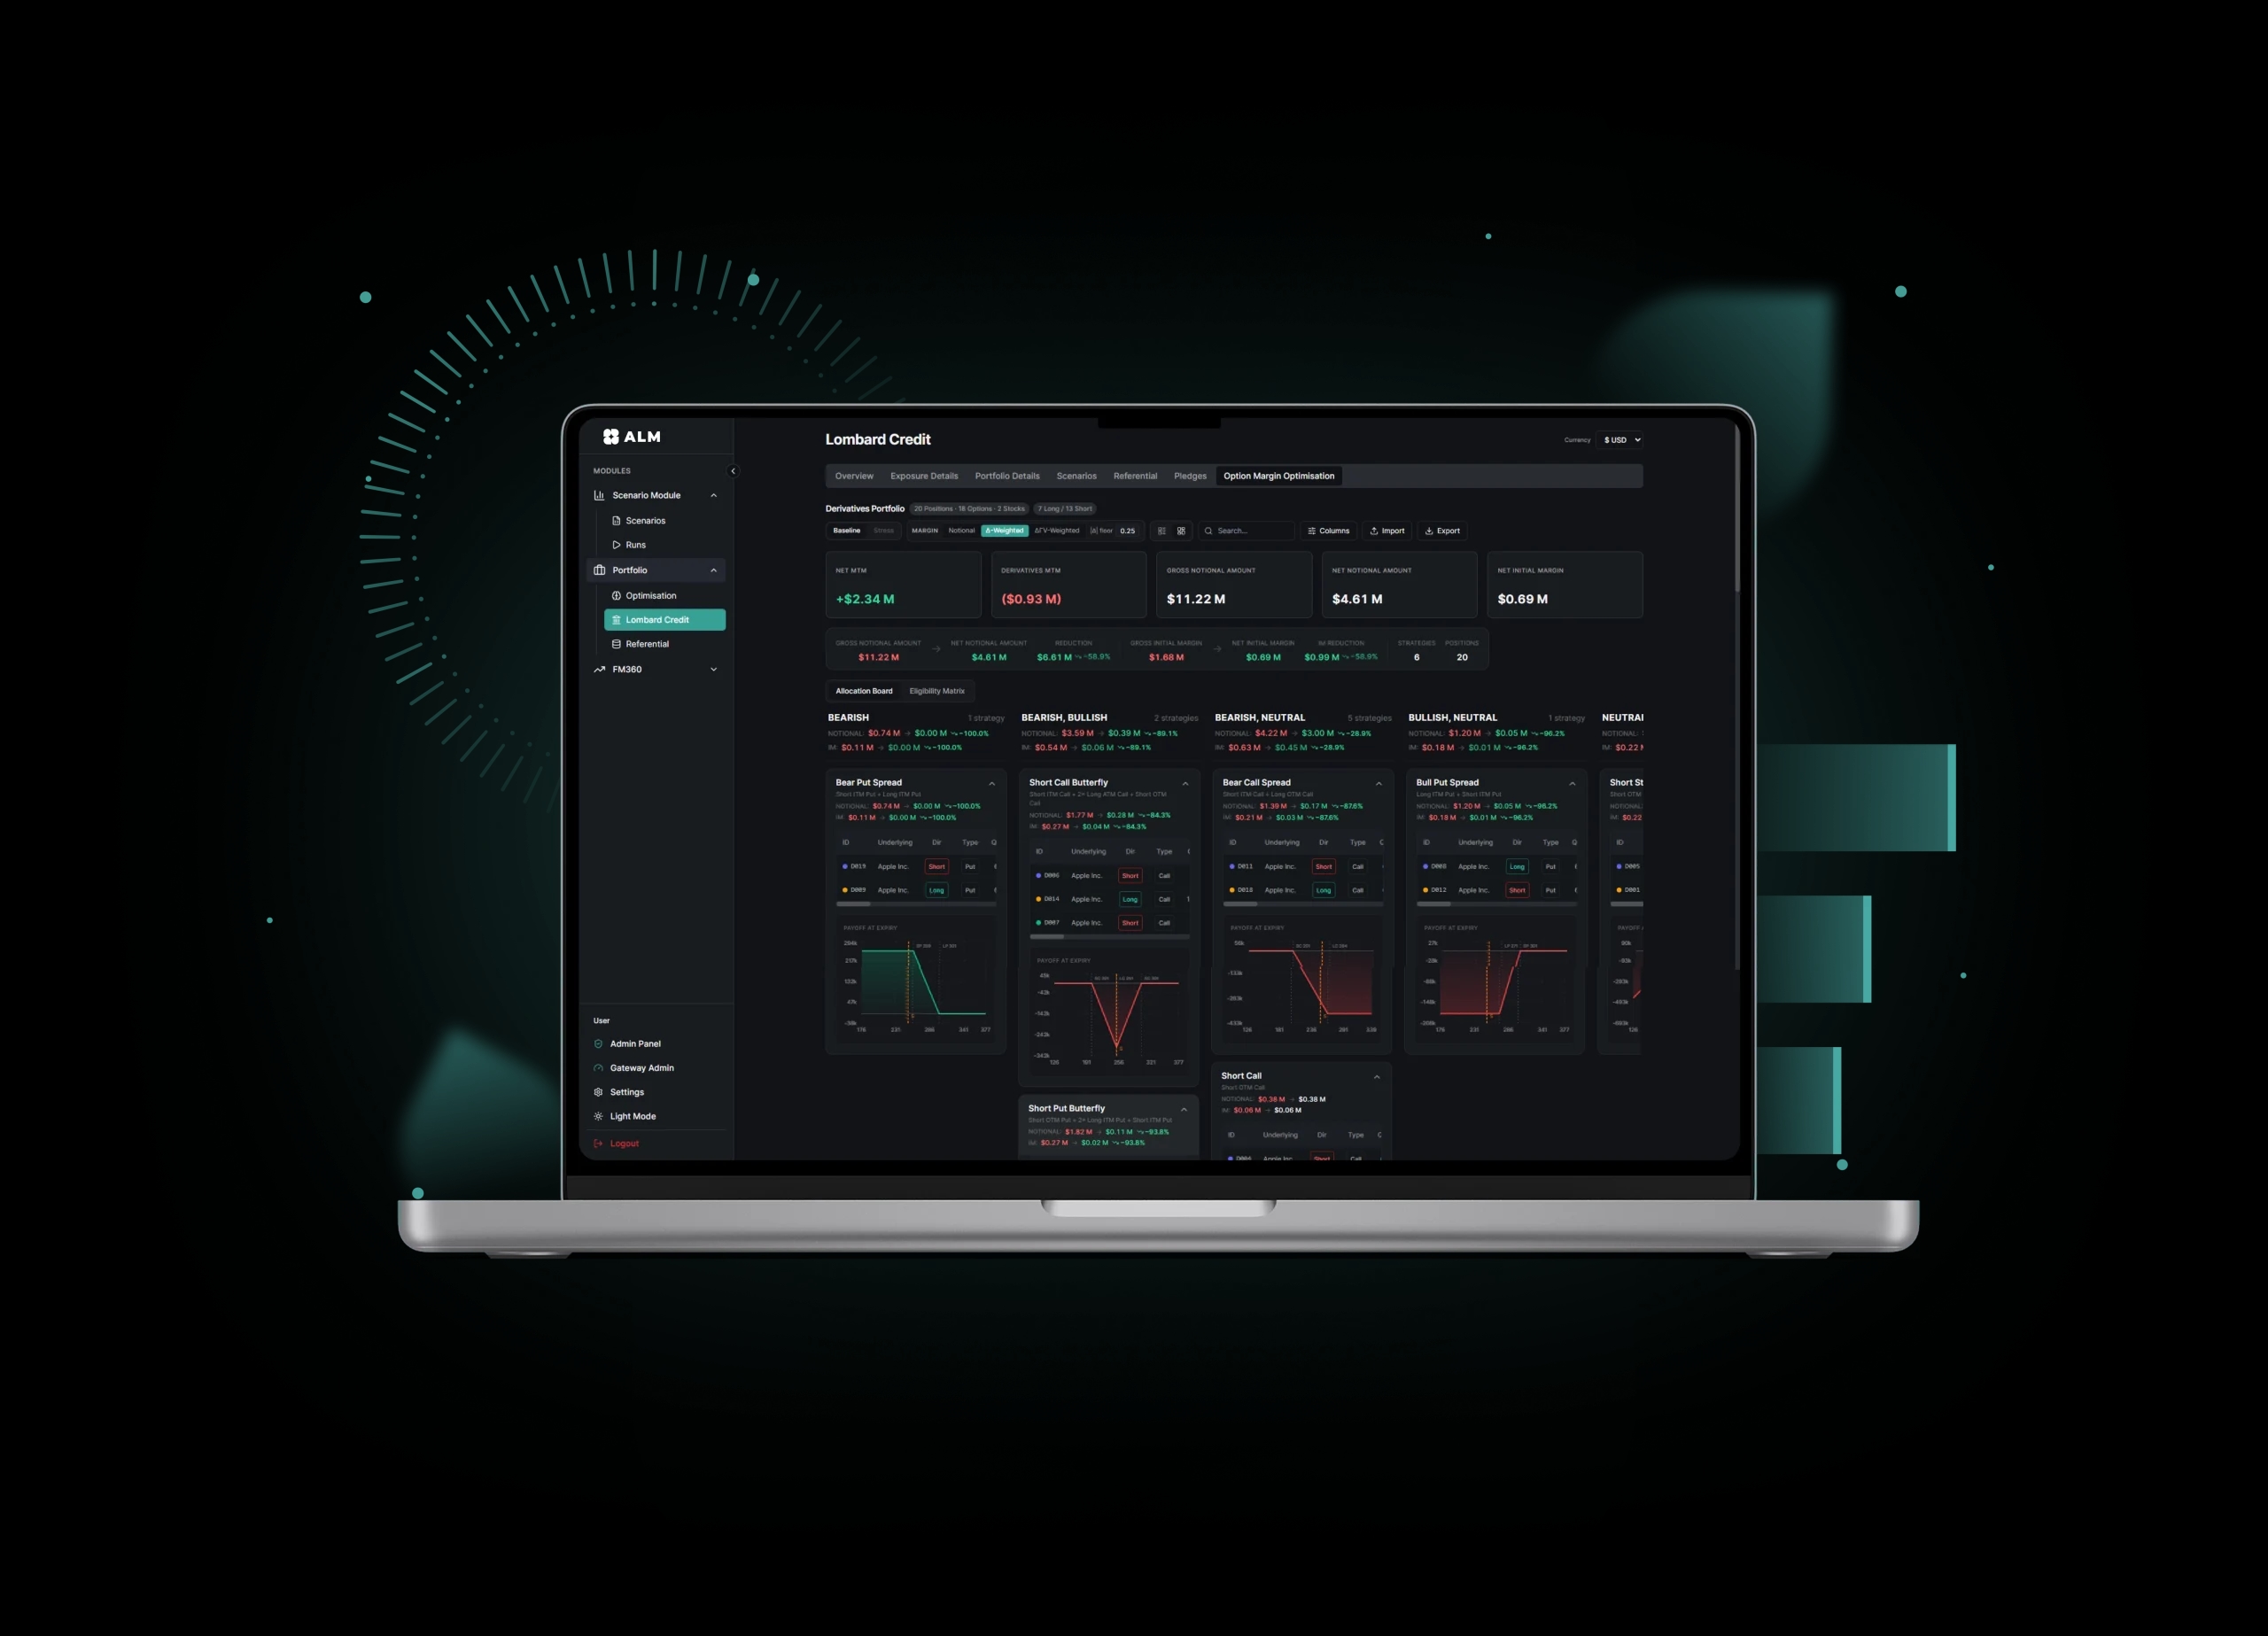
7. Option Margin Optimization
This function helps users work through option strategies and see what each one means for margin exposure. Strategies are grouped into categories including bearish, bearish-bullish, bearish-neutral, bullish-neutral, and neutral, with each card showing underlying assets, direction, option type, notional value, margin impact, and a payoff-at-expiry chart. It gives users a structured way to evaluate hedging strategies without relying on separate modelling tools.
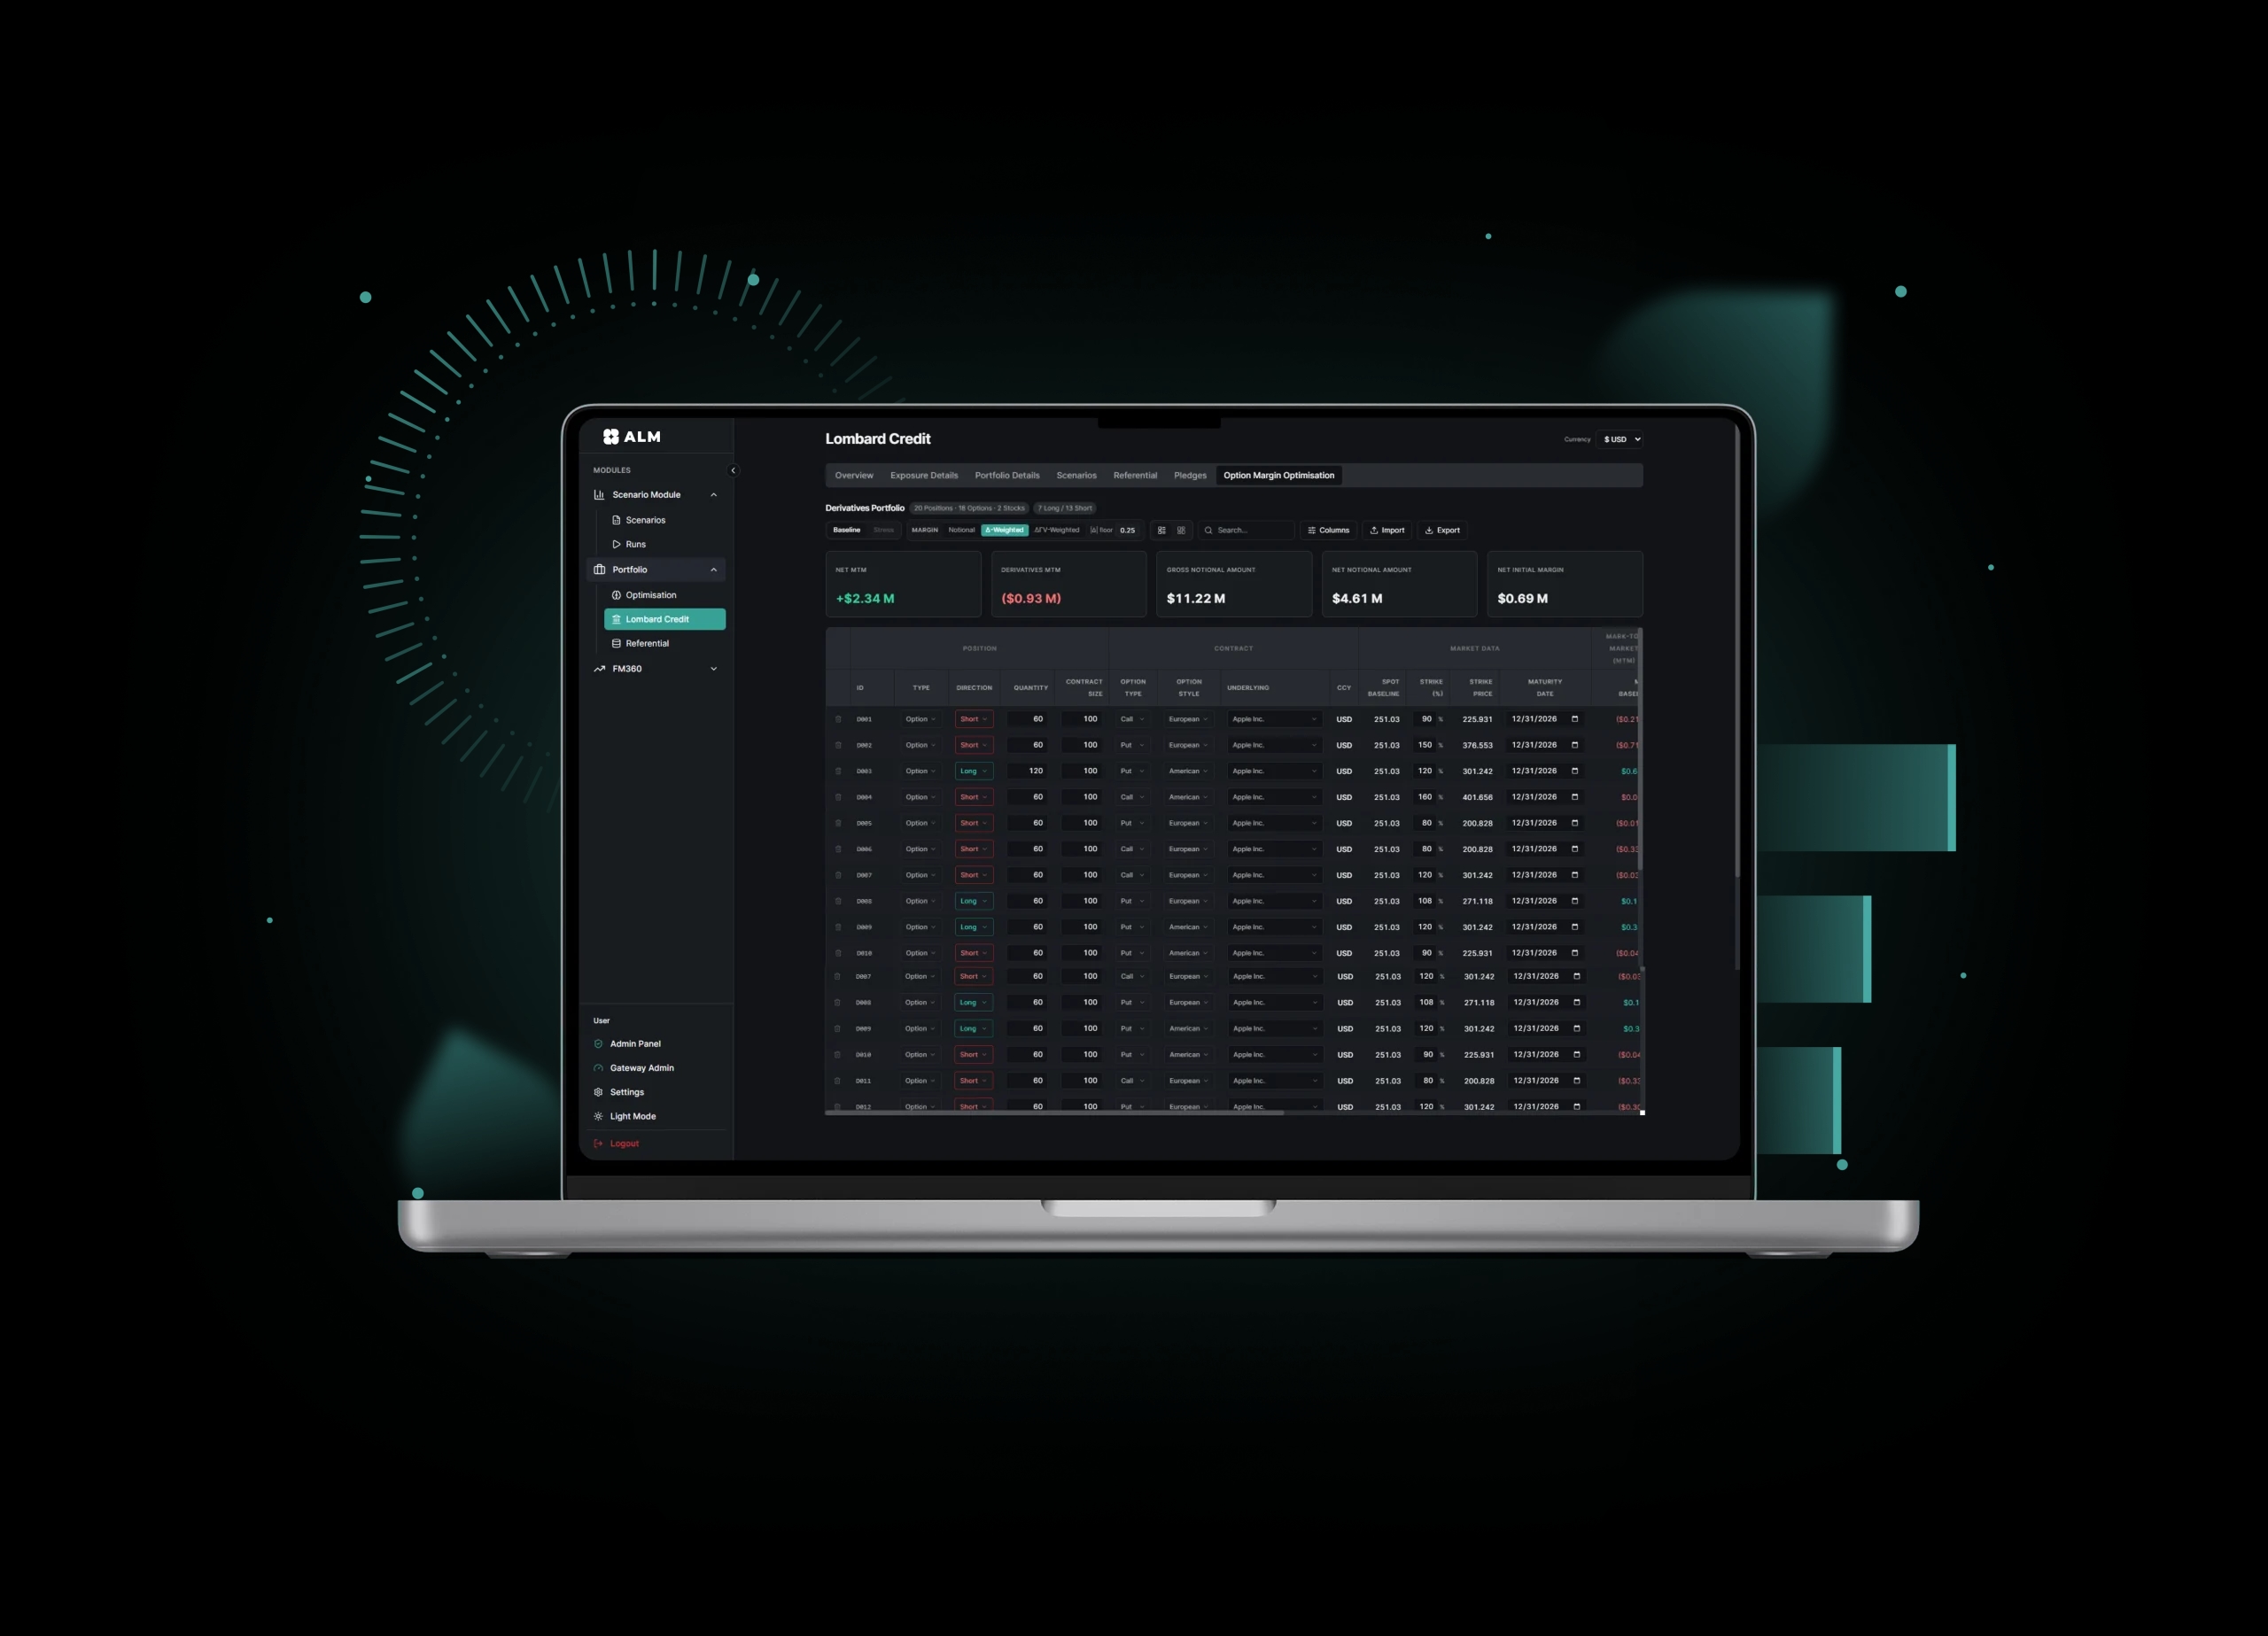
8. Option Margin Data Table
Where the optimization screen gives the strategic view, the data table goes row-level. Users can review strike price, maturity date, MTM baseline, Greeks, strategy, gross notional, net notional, margin rate, and initial margin for each position. Color-coded values make it easy to read positive and negative movements at a glance. For finance and risk teams that need the operational detail behind the strategy-level summaries, this is where they work.
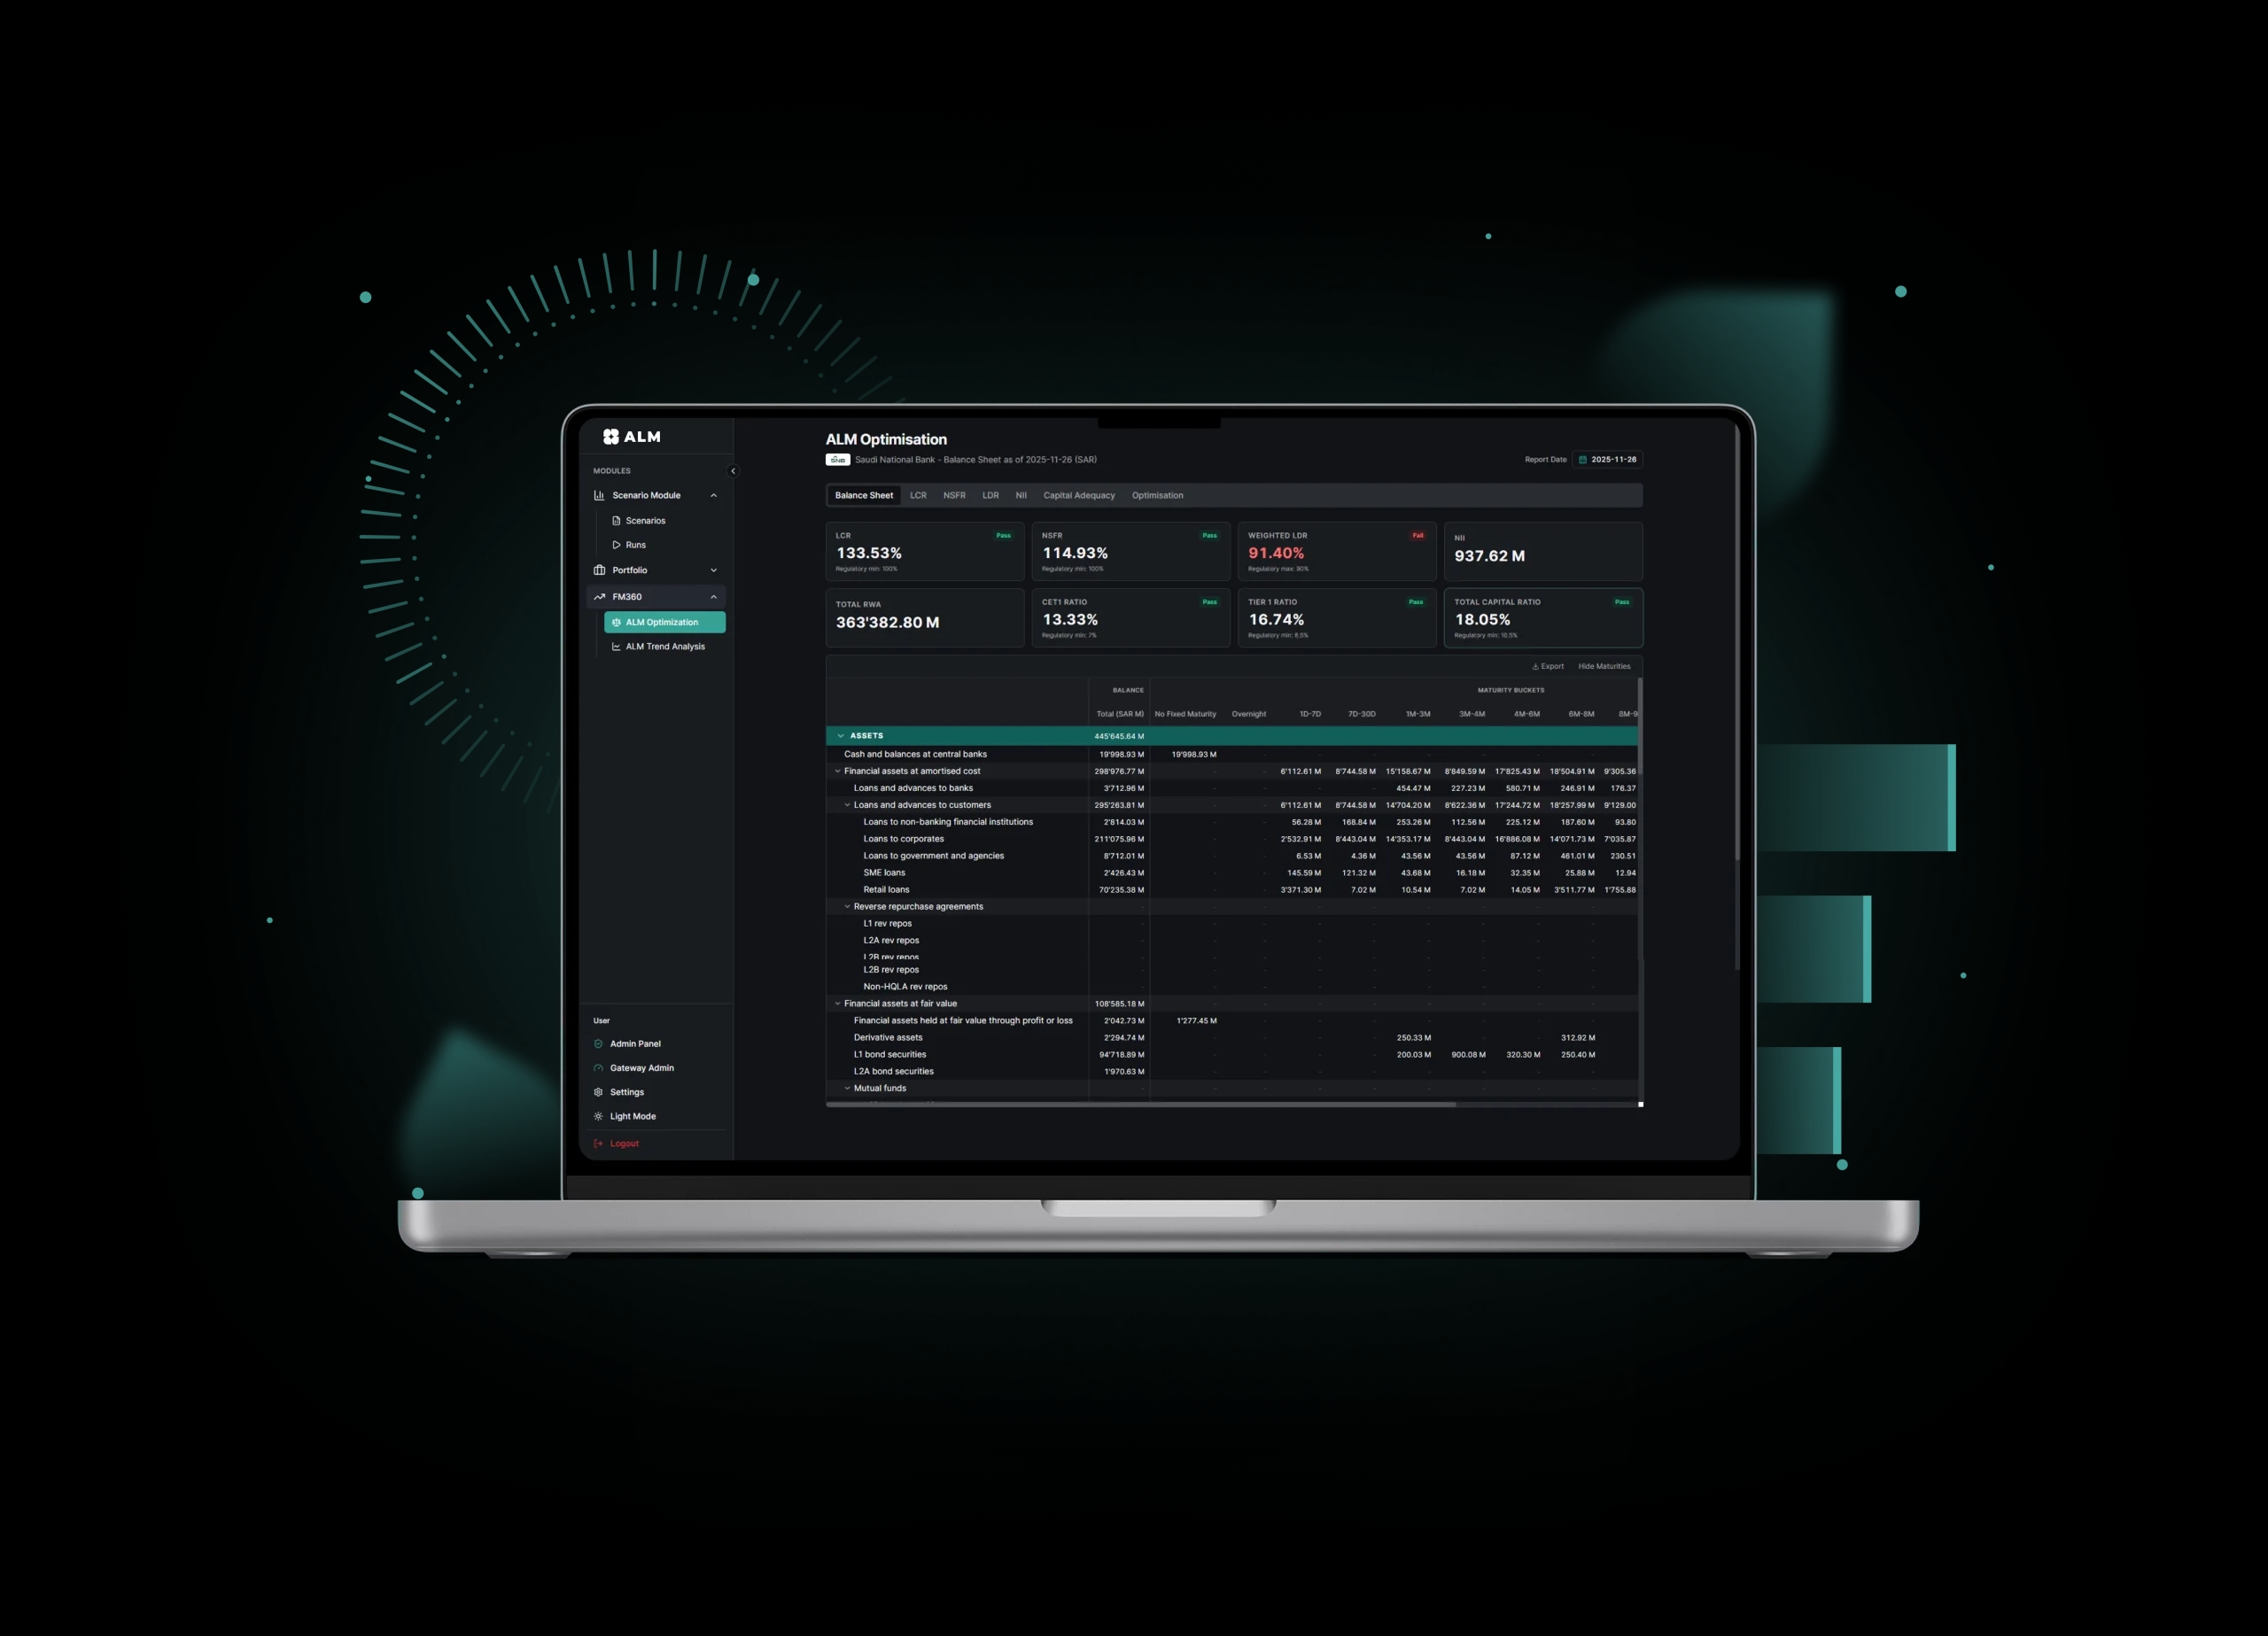
9. ALM Optimization
Treasury teams use the ALM Optimization screen to assess balance sheet health across liquidity, funding, capital, and maturity dimensions. KPI cards cover LCR, NSFR, weighted LDR, NII, total RWA, CET1 ratio, Tier 1 ratio, and total capital ratio. Tabs for balance sheet, LCR, NSFR, LDR, NII, capital adequacy, and optimization let users drill into specific areas. The maturity table allows direct comparison across baseline, optimized, and applied optimization views, giving treasury a structured foundation for balance sheet decision-making.
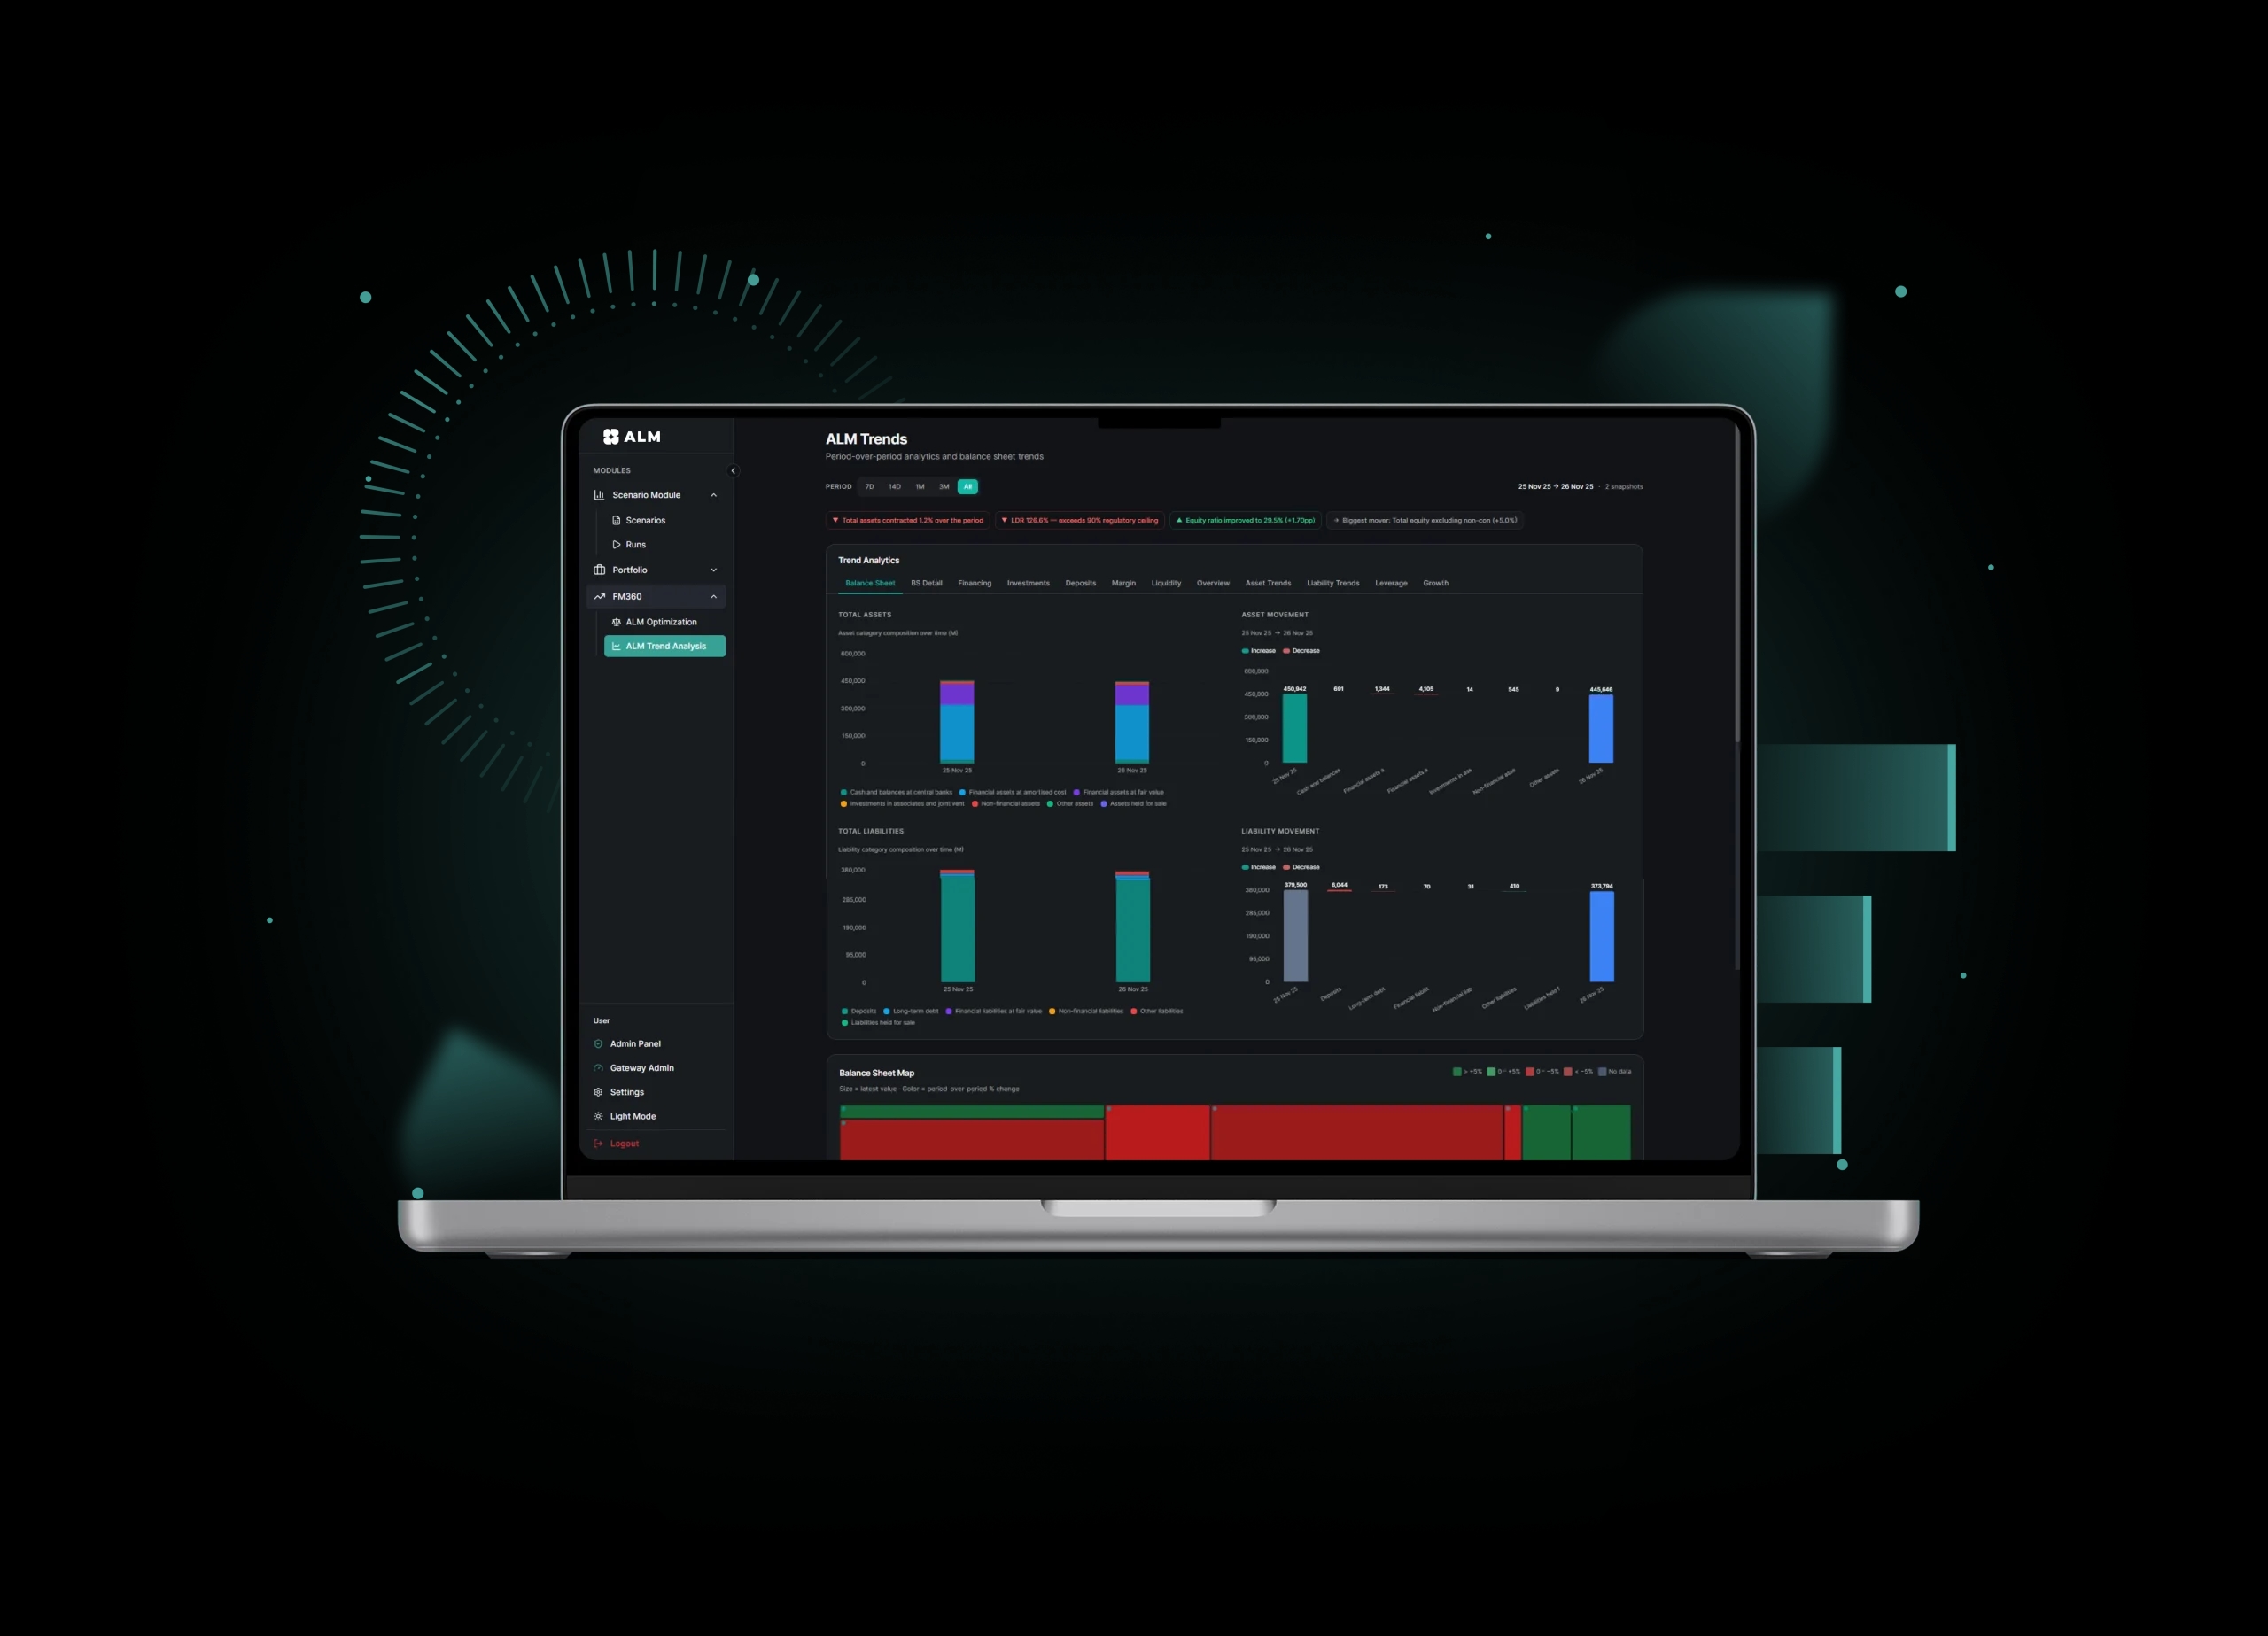
10. ALM Trend Analysis
This screen helps leadership and finance teams see how financial metrics move over time. Section trends, waterfall analysis, and a balance sheet map give users a clear picture of what is increasing, decreasing, or holding steady across assets, liabilities, and equity. Rather than reconstructing this view from scratch each period, teams can track balance sheet patterns continuously and flag movements before they become problems.
Technology Stack
Scenario Analysis Platform is built on a secure, cloud-native financial platform architecture using modern frontend frameworks, enterprise-grade authentication, financial computation engines, and scalable cloud infrastructure.
Frontend
React, TypeScript, Vite
Backend
Python, FastAPI, Uvicorn
Tailwind CSS
PostgreSQL, shadcn/ui, Radix UI, Lucide React
Tables and Forms
TanStack Table, React Hook Form, Zod
Charts and Visualization
Zustand
File Processing and Export
SheetJS, PapaParse, ExcelJS, jsPDF, html2canvas, pptxgenjs
Database
PostgreSQL
Authentication
WSO2 Identity Server, OpenID Connect, JWT, PKCE
API Gateway
Kong
Security
Coraza WAF, OWASP CRS, AES-256-GCM Payload Encryption
Cloud and Deployment
Docker, Kubernetes, Kustomize, AWS, Google Cloud
Monitoring
Prometheus, Grafana, Loki, Promtail
Data Services
AWS Lambda, AWS API Gateway, AWS S3, AWS Glue, PyArrow
Financial Computation
SciPy, NumPy, Black-Scholes, CRR Binomial Model, Toshiba SQBM+ Integration
Conclusion
Scenario Analysis Platform transformed complex financial risk analysis into a centralized, secure, and scalable digital platform for modern financial institutions. By bringing scenario management, referential market data, portfolio optimization, Lombard credit monitoring, derivatives margin analysis, option strategy evaluation, ALM optimization, and ALM trend analysis into one connected system, we helped the client improve decision-making, reduce manual effort, strengthen operational control, and build a future-ready foundation for financial innovation.


NEED A CUSTOM FINTECH SOLUTION?
Let us help you build a financial platform tailored to your business needs.